Generic selectors
Exact matches only
Search in title
Search in content
Post Type Selectors

Popular stocks

Crypto

CFD

Currencies

Support

Gold

EUR/USD – Technical Analysis – 1D

August 20, 2025 07:34

Quick Summary

The chart exhibits a notable bullish trend from March to May. Subsequently, there is a sideways market movement from June to August. Key resistance and support levels are identified at 1.1800 and 1.1400, respectively.

Observing volume trends alongside candlestick formations is crucial in understanding market sentiment and momentum.

Candlestick Analysis

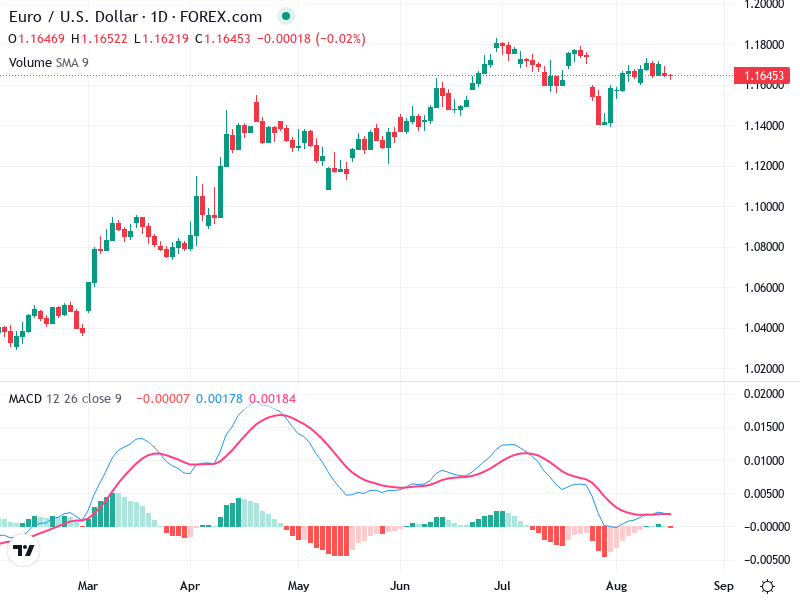
Initially, the chart showcases a bullish trend from March to May, transitioning to a sideways movement from June to August.

A prominent bullish engulfing pattern appeared in early April, highlighting a strong upside reversal.

Current small-bodied candlesticks suggest market indecision.

MACD Analysis

The MACD line slightly surpasses the Signal line, indicating a weak bullish crossover with minimal momentum.

The MACD histogram's proximity to zero reflects weak market momentum and a lack of strong sentiment in either direction.

There are no evident divergences between the MACD and price action, suggesting alignment between momentum and price.

Volume Analysis

Volume has been decreasing as the price entered a sideways phase, typical of a consolidation phase.

There were volume spikes during the April bullish trend, confirming increased buying interest.

The current decline in volume during sideways movements indicates traders' lack of conviction.

Support & Resistance

Support is evident around 1.1400, confirmed by multiple tests in June.

Resistance is approximately at 1.1800, frequently tested without a sustained breakout.

These levels are essential for observing potential breakouts or reversals.

Actionable Insights

Consider a buy strategy on a confirmed breakout above 1.1800 with increased volume.

A sell strategy may be viable on a breakdown below 1.1400 with strong volume.

Hold positions during the sideways trend unless a breakout occurs, and monitor MACD for clear crossovers and rising volume.

The AI Technical Analysis Center is an informational tool only and does not constitute investment or trading advice.
This site is registered on wpml.org as a development site. Switch to a production site key to remove this banner.