Generic selectors
Exact matches only
Search in title
Search in content
Post Type Selectors

Popular stocks

Crypto

CFD

Currencies

Support

Gold

OIL – Technical Analysis – 1D

August 20, 2025 07:41

Quick Summary

This chart of crude oil futures displays a complex narrative in the current market dynamics. The interplay of technical indicators hints at potential shifts, while the surrounding economic variables add an additional layer of influence. Traders should pay close attention to emerging trends and small cues that could signify larger movements.

Candlestick Analysis

The chart shows mixed candlestick patterns without any immediately clear strong bullish or bearish patterns like a hammer or engulfing.

Recently, a series of small-bodied candles indicate indecision in the market.

The overall recent trend is bearish, with prices making lower highs and lower lows since the peak in mid-July.

MACD Analysis

The MACD line is below the Signal line, indicating bearish sentiment.

The lines appear to be converging, suggesting a potential bullish crossover if momentum shifts.

The histogram shows diminishing negative values, which could indicate weakening bearish momentum.

Volume Analysis

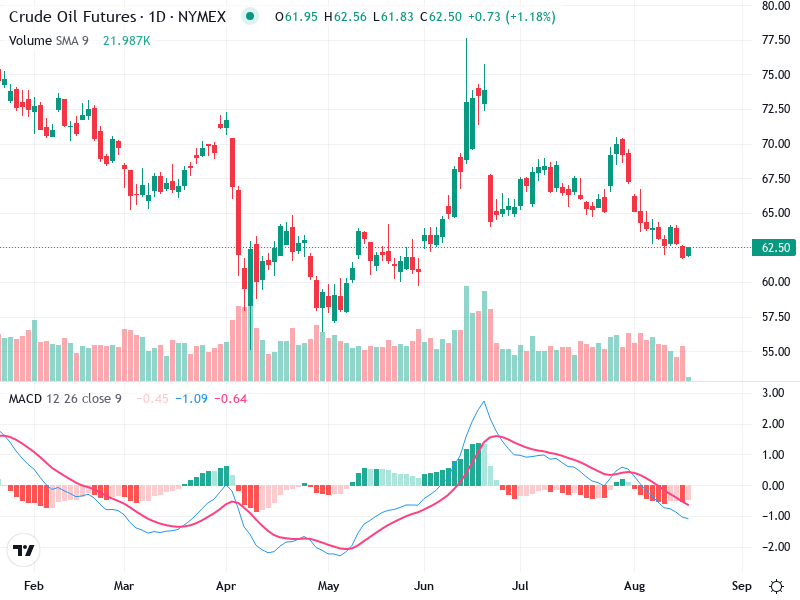
Volume has been decreasing, aligning with the period of price declines, suggesting lack of strong selling conviction.

However, there are no significant volume spikes indicating strong buying interest.

The lower volume during the recent downtrend may indicate a potential lack of strong conviction, or traders might be waiting for a clearer signal.

Support & Resistance

Key support is around $60, which has held in previous downturns.

Immediate resistance is at $65, as recent action shows selling pressure around this area.

Breaking through either of these zones with high volume could signal a stronger directional move.

Actionable Insights

Consider buying if MACD shows a bullish crossover and price action rebounds from the $60 support with increased volume.

Short positions could be entertained if price breaks below the $60 support with strong volume and bearish candlestick patterns.

Holding might be advisable until clearer signals are observed, especially with current low volume and lack of decisive patterns.

The AI Technical Analysis Center is an informational tool only and does not constitute investment or trading advice.
This site is registered on wpml.org as a development site. Switch to a production site key to remove this banner.