Generic selectors
Exact matches only
Search in title
Search in content
Post Type Selectors

Popular stocks

Crypto

CFD

Currencies

Support

Gold

GOLD – Technical Analysis – 1D

August 21, 2025 07:03

Quick Summary

The gold Futures chart displays a market currently experiencing indecision, with price movement contained within a tight range.

Traders are closely watching critical support and resistance levels for potential breakout scenarios.

Candlestick Analysis

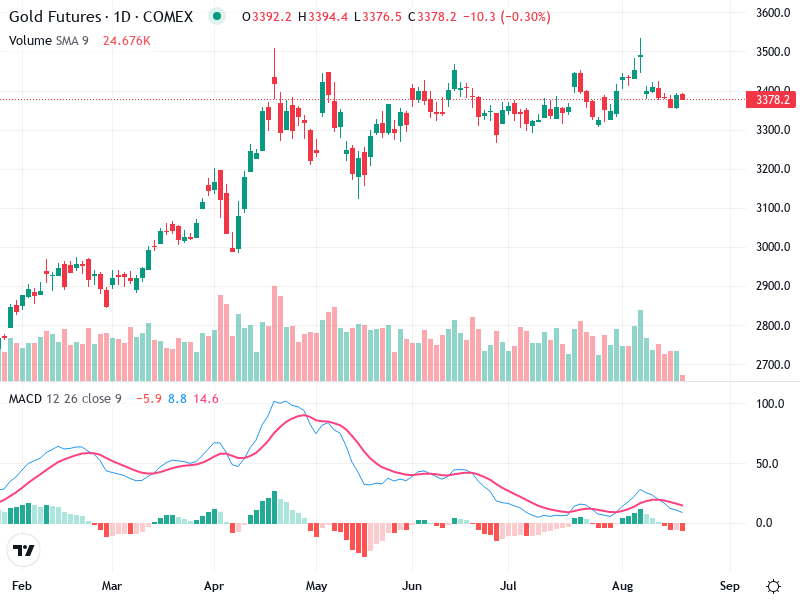
A potential doji was observed recently, indicating a possible indecision in the market. This could suggest a forthcoming reversal if confirmed with subsequent action.

The trend appears sideways with some range-bound activity since June, following an earlier bullish phase from February to April.

Resistance is near the 3,500 level, where multiple attempts to break higher failed. Support appears around 3,300, suggesting a relatively tight range for recent price action.

MACD Analysis

The MACD line is crossing below the Signal line, suggesting bearish momentum.

The histogram is turning negative, confirming weakening momentum, which aligns with the sideways to bearish short-term price action.

No clear divergences between MACD and price action are observed at the moment.

Volume Analysis

Volume spikes are aligned with failed attempts to break resistance at the 3,500 level, suggesting those levels are actively defended.

Higher volumes have correlated with minor bearish movements, emphasizing potential selling pressure at higher levels.

No significant institutional activity spikes are evident outside of normal fluctuation patterns.

Support & Resistance

Resistance is around the 3,500 level.

Support is around the 3,300 level.

These levels are crucial for traders watching for breakouts on either side of the range for trend continuation or reversal.

Actionable Insights

Consider entering on confirmed breakouts above 3,500 with strong volume and MACD support.

Shorts could be explored on breakdowns below 3,300, especially with strong volume confirmation.

Current range-bound conditions suggest waiting for clear directional cues.

The AI Technical Analysis Center is an informational tool only and does not constitute investment or trading advice.
This site is registered on wpml.org as a development site. Switch to a production site key to remove this banner.