Generic selectors
Exact matches only
Search in title
Search in content
Post Type Selectors

Popular stocks

Crypto

CFD

Currencies

Support

Gold

OIL – Technical Analysis – 1D

August 21, 2025 07:09

Quick Summary

The technical analysis of crude oil futures highlights a bearish trend with crucial support and resistance levels. The market shows signs of cautious sentiment and ongoing consolidation.

Key indicators, such as candlestick patterns and MACD signals, provide insights into potential price movements.

Volume stability suggests a lack of strong conviction from market participants, warranting close observation.

Candlestick Analysis

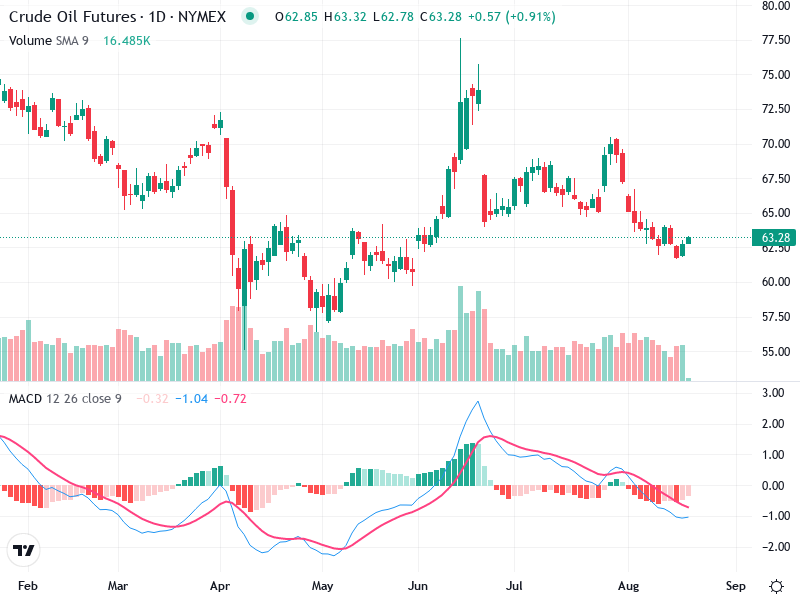
The recent trend is bearish, reflected in a sequence of lower highs and lows since mid-July.

A small bullish candlestick has formed, which might indicate a short-term reversal, although strong reversal patterns are absent.

Support is evident around the $62 mark, with resistance near $70 following a failed upward breakout attempt.

MACD Analysis

The MACD line remains below the Signal line, supporting the bearish momentum.

A possible MACD crossover could emerge as the lines converge, signaling potential momentum shift.

The MACD histogram is negative but shows signs of diminishing bearish momentum with shrinking bars.

Volume Analysis

Volume has been stable without significant spikes to support price movements.

This stable volume does not strongly corroborate or contradict the recent price declines, implying market participants exhibit low conviction.

No unusual volume spikes have been detected, suggesting limited institutional trading activity.

Support & Resistance

Support has formed around $62, representing a vital level traders might consider for potential entries.

Resistance appears near $70, where prior bullish efforts were thwarted, indicating a strong seller presence.

These levels are pivotal for monitoring future price actions.

Actionable Insights

Short-term traders may look for bullish confirmation at the current support to execute a bounce play.

Long-term investors should possibly refrain from new positions until a clear direction or resistance breakout is confirmed.

Keep an eye on a break below $62 with increased volume, which could serve as a sell signal.

The AI Technical Analysis Center is an informational tool only and does not constitute investment or trading advice.
This site is registered on wpml.org as a development site. Switch to a production site key to remove this banner.