Generic selectors
Exact matches only
Search in title
Search in content
Post Type Selectors

Popular stocks

Crypto

CFD

Currencies

Support

Gold

AUD/USD – Technical Analysis – 4h

August 22, 2025 07:06

Quick Summary

The AUD/USD 4-hour chart indicates a dominant bearish trend. Recent price actions are focused around key support and resistance areas.

Traders are advised to monitor for potential bullish crossovers and volume increases that could signal a reversal.

Candlestick Analysis

The chart shows a bearish trend with the price steadily moving downward.

Small-bodied candlesticks with long wicks near the current price level indicate indecision.

Price is consolidating around the 0.6420 area, showing hesitation after a decline.

MACD Analysis

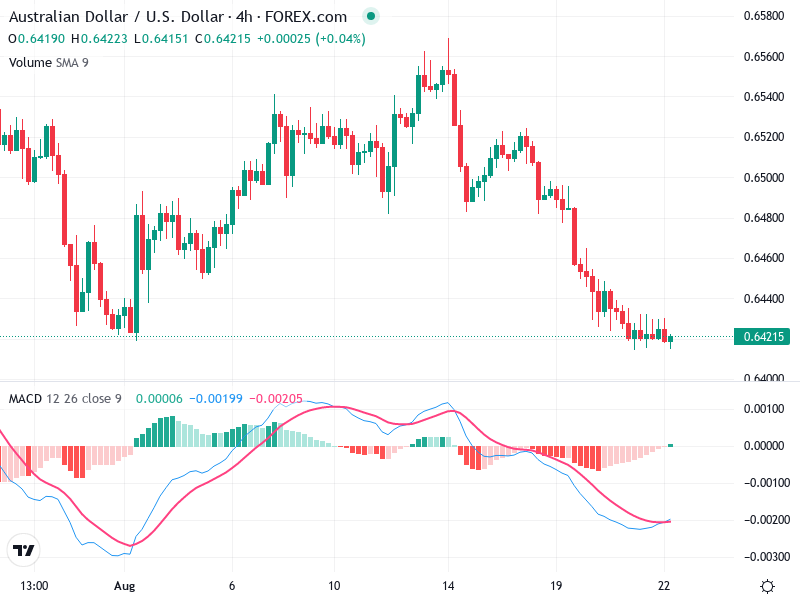
The MACD line is slightly above the signal line but remains below the zero line, suggesting bearish momentum.

The MACD histogram bars are shortening, indicating a potential slowing of bearish momentum.

No significant MACD and price action divergences were observed.

Volume Analysis

Volume trends are stable with no significant spikes, suggesting lack of strong selling pressure.

No indication of institutional activity due to absence of high volume spikes.

Stable volume during a downtrend is notable.

Support & Resistance

Near-term support is seen around 0.6410-0.6420 where the price stabilizes.

Immediate resistance is at 0.6460, pivotal for a potential trend reversal.

Monitoring these levels is crucial for anticipating movements.

Actionable Insights

Consider buying if the price breaks above 0.6460 with strong volume and confirmed MACD bullish crossover.

A breakdown below 0.6410 support with increased volume could offer a short-selling opportunity.

Indecision suggests holding until a clearer trend emerges.

The AI Technical Analysis Center is an informational tool only and does not constitute investment or trading advice.
This site is registered on wpml.org as a development site. Switch to a production site key to remove this banner.