Generic selectors
Exact matches only
Search in title
Search in content
Post Type Selectors

Popular stocks

Crypto

CFD

Currencies

Support

Gold

GBP/USD – Technical Analysis – 4h

August 22, 2025 07:08

Quick Summary

The GBP/USD chart is exhibiting a dominant bearish trend as observed from the analysis.

The indicators suggest that the bearish momentum might persist unless there’s a significant reversal pattern.

Candlestick Analysis

The overall trend in this 4-hour chart is downward, starting from the peak around the 17th of August.

There is an indication of a bearish engulfing pattern forming around the top (17th August), signaling the start of the downtrend.

The latest candlesticks do not show a strong reversal pattern yet, but there is a small candle at the bottom indicating potential indecision or a temporary pause in the trend.

MACD Analysis

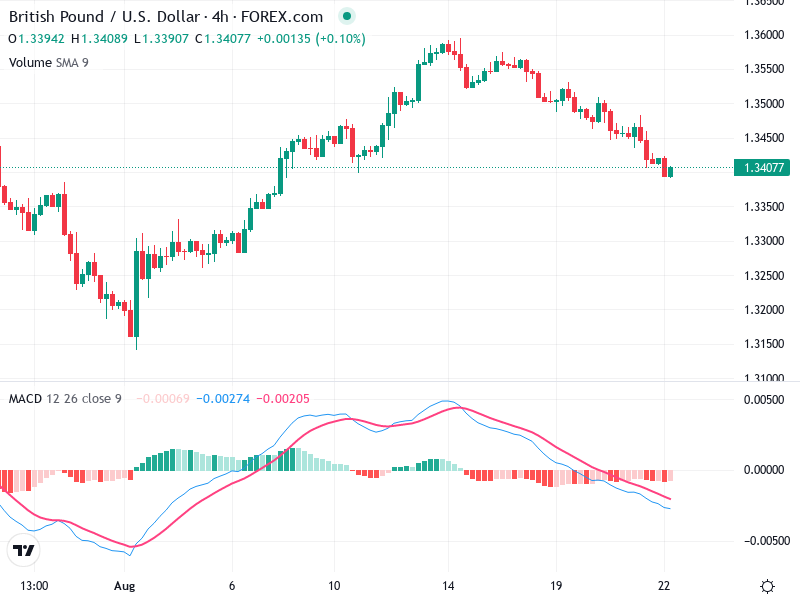
The MACD line is below the Signal line, suggesting a continued bearish momentum.

The histogram shows increasing negative values, which aligns with the strengthening downtrend.

Currently, there doesn't appear to be any significant divergence between the MACD trend and the price action, supporting the bearish outlook.

Volume Analysis

The chart does not provide detailed volume information regarding spikes. However, volume usually drops during consolidation phases, which might be happening as the trend approaches the current level.

Volume should be assessed alongside potential reversal signals due to diminishing seller interest as prices decline.

The current volume dynamics need careful observation to confirm or challenge the ongoing trend.

Support & Resistance

A key support level is around 1.3400. The current price movement is testing this zone.

Resistance appears around the 1.3600 level, which was tested before the current downtrend.

Monitoring these levels is critical for anticipating potential price actions.

Actionable Insights

If the price decisively breaks below the 1.3400 support with volume confirmation, further downside can be expected.

If uncertain, observing price action around the support level can provide more clarity.

Look for bullish reversal patterns or MACD crossovers to signal potential buying. This would be riskier while under the bearish momentum.

The AI Technical Analysis Center is an informational tool only and does not constitute investment or trading advice.
This site is registered on wpml.org as a development site. Switch to a production site key to remove this banner.