Generic selectors
Exact matches only
Search in title
Search in content
Post Type Selectors

Popular stocks

Crypto

CFD

Currencies

Support

Gold

EUR/USD – Technical Analysis – 4h

August 25, 2025 07:02

Quick Summary

The EUR/USD 4-hour chart shows a notable shift in trend from a bearish phase to potential bullish movement. This change is supported by recent technical indicators and volume analysis. The chart suggests room for upward growth, contingent on key resistance levels.

Candlestick Analysis

A strong bullish candlestick has emerged, indicating a reversal from a previous downtrend. This pattern suggests buying interest at lower levels.

The trend appears to be shifting from bearish to a potential bullish movement due to recent price action.

Upward surges between 1.1650 and 1.1700 highlight a breakout from prior consolidation.

MACD Analysis

The MACD line crossing above the Signal line indicates a bullish crossover, suggesting increased upward momentum.

The histogram is positive and expanding, supporting a continued bullish trend, implying ongoing upward movement.

No significant divergences between MACD and price action reinforces the current upward trend.

Volume Analysis

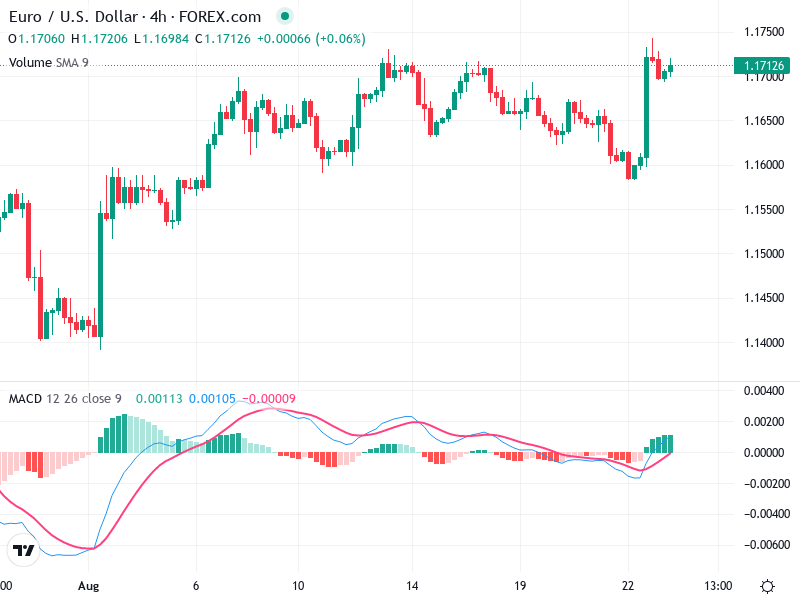
A noticeable spike in volume accompanies the recent bullish candle, demonstrating strong buying interest and supporting the price increase.

Increased volume supports the upward trend, indicating the potential for this trend to be sustainable.

The volume spike suggests possible institutional activity, lending credibility to the current bullish movement.

Support & Resistance

Support has been established around 1.1500, a level that has repeatedly held in recent history.

Immediate resistance is identified near 1.1750; a breakout here could boost bullish momentum.

These levels are vital for identifying potential reversal points or further breakouts, necessitating close monitoring.

Actionable Insights

Consider a long position if the price remains above 1.1700 with continued volume support, looking for a confirmation on a break above 1.1750.

A short position could be viable if the price drops below 1.1650, especially with decreasing volume.

Monitor for bearish candlestick formations or weakening MACD as potential indicators of a trend reversal.

The AI Technical Analysis Center is an informational tool only and does not constitute investment or trading advice.
This site is registered on wpml.org as a development site. Switch to a production site key to remove this banner.