Generic selectors
Exact matches only
Search in title
Search in content
Post Type Selectors

Popular stocks

Crypto

CFD

Currencies

Support

Gold

GOLD – Technical Analysis – 4h

August 25, 2025 07:03

Quick Summary

The analysis of the gold Futures 4-hour chart reveals significant patterns and potential price movements.

The recent bullish signals provide insights into possible price directions supported by technical indicators.

Continued observation of key levels will guide trading decisions.

Candlestick Analysis

A bullish engulfing pattern is visible around the mid-point of the chart, indicating a potential reversal from a downtrend to an uptrend.

A recent strong bullish candle has occurred at the right side of the chart, suggesting potential momentum towards the upside.

The chart shows a transition from a strong bearish trend to a possible bullish reversal.

MACD Analysis

A bullish crossover is seen where the MACD line crosses above the Signal line, suggesting a buy signal.

The histogram is increasing, indicating growing momentum in the bullish direction.

No significant divergences noted between the MACD and the price action, aligning directionally upward.

Volume Analysis

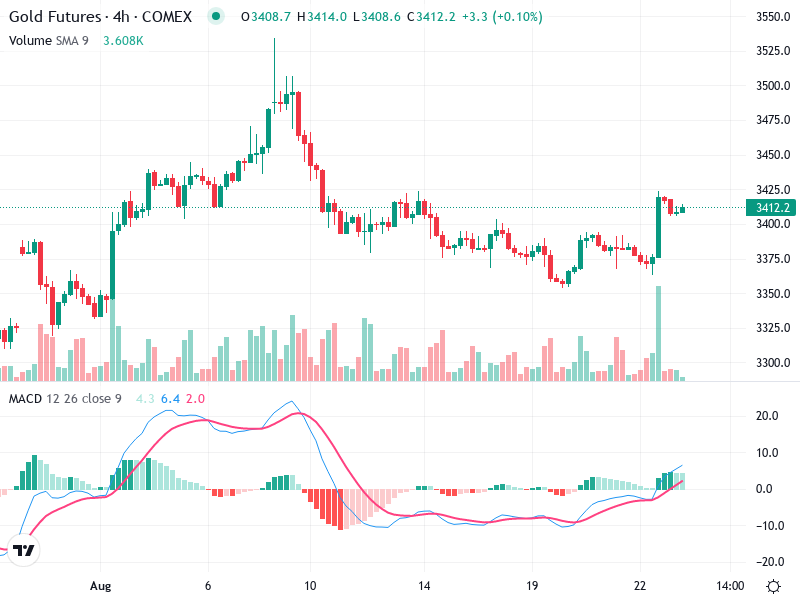
There is a noticeable spike in volume accompanying the recent price rise, which validates the strength of the movement.

The increase in volume on the bullish candle supports the breakout, suggesting strong buying interest.

The spike suggests potential institutional buying, reinforcing the bullish sentiment.

Support & Resistance

Around 3375, which previously acted as resistance and may now serve as a support.

Approximately 3450 levels could act as the next resistance. A break above this would further confirm bullish strength.

Monitoring these levels is essential for trading strategies.

Actionable Insights

Consider buying on pullbacks near support levels of 3375 if supported by sustained volume.

Watch for any reversal patterns or weakening of volume near the 3450 resistance level for potential profit-taking.

Holding positions could be beneficial if momentum sustains above the breakout zone.

The AI Technical Analysis Center is an informational tool only and does not constitute investment or trading advice.
This site is registered on wpml.org as a development site. Switch to a production site key to remove this banner.