Generic selectors
Exact matches only
Search in title
Search in content
Post Type Selectors

Popular stocks

Crypto

CFD

Currencies

Support

Gold

NSDQ – Technical Analysis – 4h

August 26, 2025 07:00

Quick Summary

The chart shows historical price movements and potential future directions. It highlights key technical indicators that might influence trader decisions. The asset has shown both bullish and bearish tendencies recently, suggesting mixed market sentiment.

Candlestick Analysis

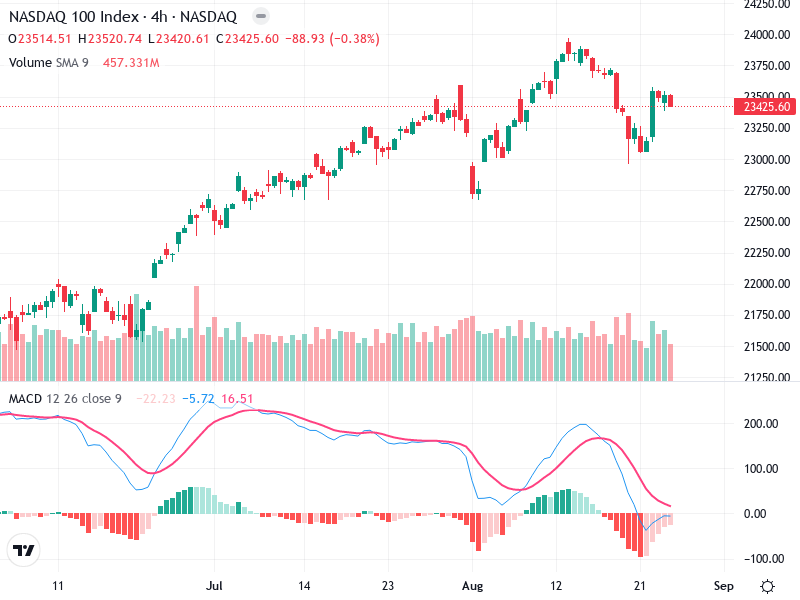
Recently, a doji candlestick is visible, suggesting indecision in the market. This could indicate a potential reversal or a continuation depending on confirmation from subsequent candles.

Earlier, the chart reflected a series of bullish candles, suggesting a strong upward momentum which has recently shifted.

The trend has been predominantly bullish, with a recent pullback indicating potential consolidation or a shift.

MACD Analysis

Currently, the MACD line is attempting to cross above the Signal line from below, suggesting a potential bullish crossover. This could indicate an upward momentum if confirmed.

The histogram bars recently turning positive suggest a shift towards bullish momentum.

No clear divergences visible between MACD and price action at the moment.

Volume Analysis

Volume spikes are visible during the bullish and subsequent sideways movement. This suggests activity by larger market players.

The increase in volume during the uptrend supports the bullish price movement earlier. Recent volume shows decreased momentum, aligning with current consolidation.

No immediate unusual spikes suggesting strong institutional activity at this time.

Support & Resistance

Around 23,200 has shown to act as a support level during recent pullbacks.

Around 23,750 is acting as a resistance point, previously tested during uptrends.

The current consolidation phase might test these levels in the near future.

Actionable Insights

Consider entering on confirmation of a bullish crossover in MACD and a breakout above the 23,750 resistance with strong volume support.

Watch for failures to break resistance or bearish patterns near resistance levels.

Current price consolidation suggests waiting for clearer confirmation signals for bullish or bearish continuation.

The AI Technical Analysis Center is an informational tool only and does not constitute investment or trading advice.
This site is registered on wpml.org as a development site. Switch to a production site key to remove this banner.