Generic selectors
Exact matches only
Search in title
Search in content
Post Type Selectors

Popular stocks

Crypto

CFD

Currencies

Support

Gold

NZD/USD – Technical Analysis – 4h

August 26, 2025 07:05

Quick Summary

The chart reflects a predominantly bearish trend with lower highs and lower lows.

A bullish engulfing pattern was observed, suggesting potential for upward movement amid a bearish backdrop.

Short-term momentum may be shifting, but confirmation is needed at key levels.

Candlestick Analysis

The chart shows a predominant bearish trend, characterized by a series of lower highs and lower lows.

There's a noticeable bullish engulfing pattern around August 22, which led to a short-term upward move.

After the bullish engulfing, there's a retracement indicating a pullback, with current support near recent lows.

MACD Analysis

A bullish crossover is observed where the MACD line crosses above the Signal line, indicating a shift towards positive momentum.

The histogram is positive and increasing, supporting the bullish crossover and suggesting increasing bullish momentum.

No clear divergence is visible between MACD and price action, as recent movements align.

Volume Analysis

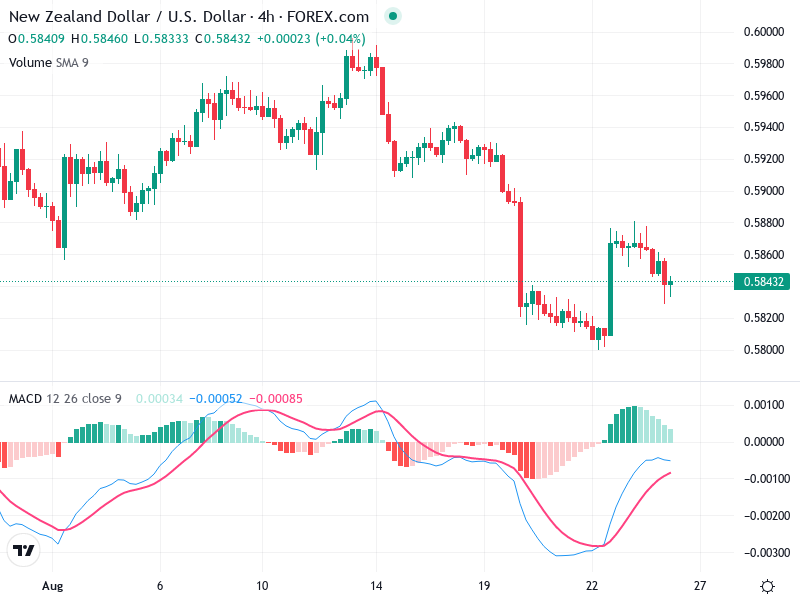
There's a visible increase in volume around August 22, coinciding with the bullish engulfing pattern, indicating strong buying interest.

The increased volume supports the upward movement post-engulfing pattern, suggesting potential institutional buying.

The volume spike at the bullish engulfing is significant, indicating a crucial level of interest for traders.

Support & Resistance

The area around 0.58200 has shown recent support, where the price potentially halted and reversed the downtrend briefly.

Near-term resistance is around 0.58600, where the recent upward movement paused. Breaking above this could signal further bullish potential.

Monitoring these levels is essential for understanding potential price shifts.

Actionable Insights

Consider buying if there is a clear breakout above the 0.58600 resistance, with confirmation through sustained volume.

If the price fails to break the 0.58600 level and reverses with bearish candlesticks, selling could be considered.

Hold positions while monitoring for confirmation signals indicating a sustained change in trend.

The AI Technical Analysis Center is an informational tool only and does not constitute investment or trading advice.
This site is registered on wpml.org as a development site. Switch to a production site key to remove this banner.