Generic selectors
Exact matches only
Search in title
Search in content
Post Type Selectors

Popular stocks

Crypto

CFD

Currencies

Support

Gold

OIL – Technical Analysis – 4h

August 26, 2025 07:09

Quick Summary

The chart currently shows a bullish reversal pattern, indicating a shift in trend from bearish to bullish. This is confirmed by the recent price increase and the breakout above previous resistance levels. However, further confirmation is needed to ensure this move is sustainable.

Candlestick Analysis

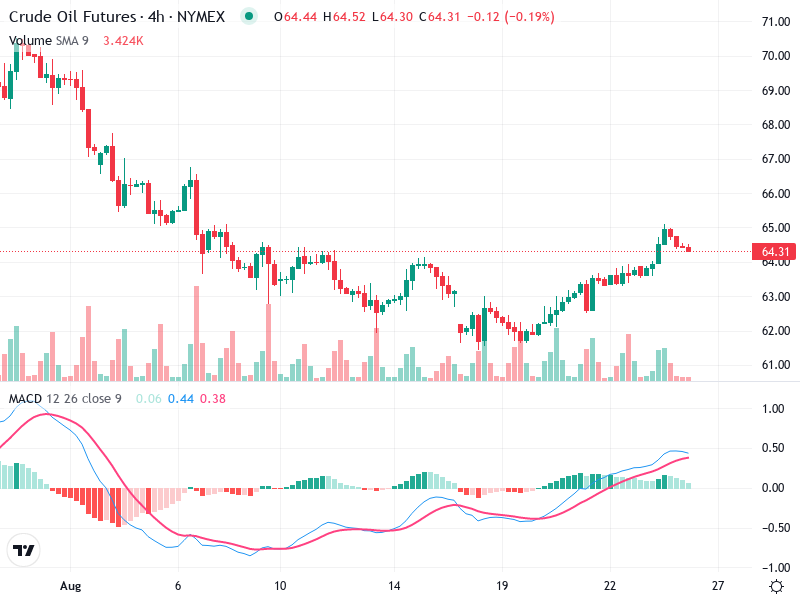
The chart displays a potential bullish reversal pattern with several green candlesticks following a downtrend, suggesting a reversal could be underway.

The trend appears to be shifting from bearish to bullish, evidenced by the recent rise in price.

There was a breakout above the previous resistance around $64, but the price is currently testing this level again as a potential pullback.

MACD Analysis

The MACD line is above the Signal line, indicating a bullish crossover occurred previously, consistent with the recent price increase.

The histogram is positive but appears to be narrowing, suggesting that bullish momentum may be slowing.

There are no clear divergences between MACD and price action at this time.

Volume Analysis

Volume increased significantly during the recent price rise, which supports the bullish move.

The alignment of increased volume with rising prices suggests that the upward movement is backed by strong buying interest.

A notable spike in volume occurred alongside the rise, potentially indicating institutional buying.

Support & Resistance

Support: Around $63, previously a resistance level, now likely acting as support.

Resistance: The $65 level is currently acting as resistance.

The test of support around $63 will be crucial for confirming the sustainability of this bullish move.

Actionable Insights

Consider buying if the price holds above the $63 support and the MACD histogram reverses its contraction, showing renewed momentum.

Watch for a bearish MACD crossover or a fall below $63 to signal potential selling.

If holding, keep an eye on volume patterns and MACD histogram changes for signs of sustained bullish momentum.

The AI Technical Analysis Center is an informational tool only and does not constitute investment or trading advice.
This site is registered on wpml.org as a development site. Switch to a production site key to remove this banner.