Generic selectors
Exact matches only
Search in title
Search in content
Post Type Selectors

Popular stocks

Crypto

CFD

Currencies

Support

Gold

NSDQ – Technical Analysis – 4h

August 27, 2025 07:00

Quick Summary

The NASDAQ 100 Index is currently displaying signs of potential bullish momentum on the 4-hour chart. Recent analysis shows a combination of technical indicators pointing towards a positive market sentiment. However, key resistance levels need to be surpassed for a confirmed continuation.

Candlestick Analysis

Observing the chart, there is a presence of bullish candlesticks indicating positive momentum.

Around mid-August, sharp declines followed by a potential bottoming tail suggest support.

The area around 23,500 looks like a consolidation zone, which could act as a potential breakout point.

MACD Analysis

There is a recent bullish crossover where the MACD line has crossed above the Signal line, suggesting potential bullish momentum.

The histogram is moving from negative to positive, indicating a shift in momentum favoring bulls.

No clear divergences are noted at this time, meaning the MACD is generally in agreement with price movements.

Volume Analysis

There are no extreme spikes, but volume appears to increase on recent up movements, supporting the bullish case.

Rising volumes with price increases reinforce the validity of upward moves.

Not significantly elevated, suggesting steady interest rather than aggressive institutional accumulation.

Support & Resistance

Key support around 23,000, as indicated by previous lows and consolidation areas.

Immediate resistance appears at approximately 23,600, where recent attempts to move higher have stalled.

If resistance is surpassed, further upward movement may be expected.

Actionable Insights

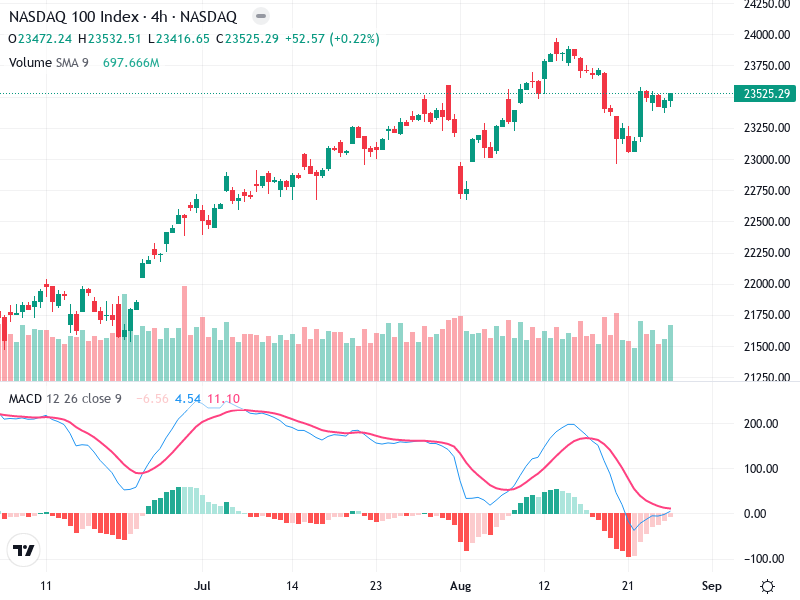
Consider buying on a confirmed breakout above 23,600 with increasing volume as confirmation.

Look for potential sell signals if the price fails to break above 23,600 and falls below 23,000, indicating weakening momentum.

If you are currently holding, watch for a sustained move above resistance or a confirmed support test before making decisions.

The AI Technical Analysis Center is an informational tool only and does not constitute investment or trading advice.
This site is registered on wpml.org as a development site. Switch to a production site key to remove this banner.