Generic selectors
Exact matches only
Search in title
Search in content
Post Type Selectors

Popular stocks

Crypto

CFD

Currencies

Support

Gold

NSDQ – Technical Analysis – 4h

August 28, 2025 07:00

Quick Summary

The NASDAQ 100 Index is currently exhibiting interesting chart patterns, highlighted by a mix of bullish and consolidating signals. Recent candlestick formations suggest potential changes in momentum, while technical indicators such as MACD offer additional insights.

The trading volume remains a crucial factor for confirming these signals, making this analysis essential for short-term trading strategies.

Candlestick Analysis

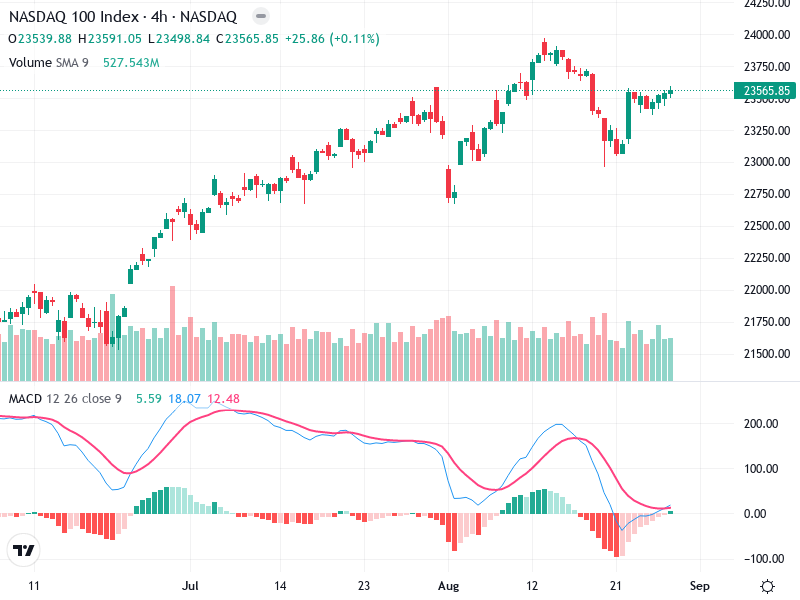
Recent candlestick patterns show a series of small-bodied candlesticks, indicating indecision or consolidation. Prior to this, a bullish engulfing pattern can be noticed, suggesting a potential reversal from the prior downtrend.

The overall trend appears to be bullish to sideways, with a noticeable uptrend interrupted by a temporary pullback.

A breakout above the 23,650 level could suggest further upward momentum. A pullback could find support around the 23,200 level.

MACD Analysis

The MACD line has crossed above the Signal line recently, indicating a bullish crossover, which suggests a potential change in momentum.

The histogram shows decreasing negative values, which signifies weakening bearish momentum and potential increasing bullish strength.

There appears to be no significant divergence between MACD and price action currently.

Volume Analysis

Volume has been decreasing slightly during the consolidation period. An increase in volume accompanied by a price breakout would confirm the strength of the move.

Volume does not confirm the recent bullish candlesticks, suggesting a need for caution until volume aligns with price action.

No significant volume spikes indicating institutional activity are present at this stage.

Support & Resistance

Near 23,200, which aligns with the recent consolidation low and prior resistance now acting as support.

Around 23,650 to 23,750, representing recent highs that need to be breached for sustained bullish activity.

Traders should be vigilant around these key levels for potential reversals or breakouts.

Actionable Insights

Consider buying if the price can close above the 23,650 resistance with increased volume.

Current holders might watch the 23,200 support for signs of weakness.

A failure to hold the 23,200 support with increased volume could suggest taking profits or setting stop-loss orders.

The AI Technical Analysis Center is an informational tool only and does not constitute investment or trading advice.
This site is registered on wpml.org as a development site. Switch to a production site key to remove this banner.