Generic selectors
Exact matches only
Search in title
Search in content
Post Type Selectors

Popular stocks

Crypto

CFD

Currencies

Support

Gold

OIL – Technical Analysis – 4h

August 28, 2025 07:09

Quick Summary

The chart shows distinct movements in the asset’s price, displaying a recent uptrend after experiencing a period of decline.

There are significant patterns emerging that suggest potential future directions. Key levels of support and resistance play a pivotal role in the current price behavior.

Candlestick Analysis

The chart shows a recent uptrend after a period of decline. The price has been making higher highs and higher lows, indicating a bullish trend development.

There is a notable bullish engulfing pattern observed around the start of the uptrend, which often signals a reversal from a prior downtrend.

The price is consolidating near the $63.50-$64.00 level, suggesting potential breakout or pullback scenarios.

MACD Analysis

The MACD line is above the Signal line, which is a bullish indicator. This crossover suggests upward momentum.

The MACD histogram shows positive values, indicating bullish momentum. However, the histogram bars are getting shorter, suggesting a potential weakening in momentum.

There are no significant divergences observed between MACD and price action at this moment.

Volume Analysis

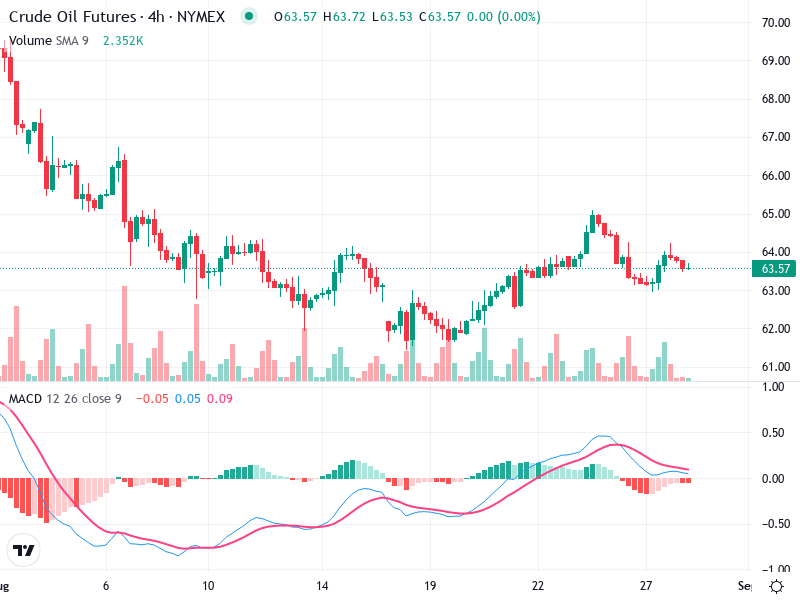
There were noticeable volume spikes accompanying the price rise, suggesting strong buying interest, likely from institutional investors.

Current volume levels seem to be stabilizing, supporting the current consolidation phase. There's no significant deviation from the volume average.

The volume activity aligns well with the price movements, adding conviction to the observed trends.

Support & Resistance

Key support level is around $62.00, which previously acted as resistance and then support after the breakout.

The primary resistance is approximately $64.50, a level tested but not yet breached successfully.

Both support and resistance levels are crucial for assessing future price directions.

Actionable Insights

Consider buying on a confirmed breakout above the $64.50 resistance with volume support.

A drop below the $63.00 level on heavy volume could signify a reversal, suggesting a sell position.

Holding is recommended if the price remains within the current consolidation range, awaiting a clearer direction.

The AI Technical Analysis Center is an informational tool only and does not constitute investment or trading advice.
This site is registered on wpml.org as a development site. Switch to a production site key to remove this banner.