Generic selectors
Exact matches only
Search in title
Search in content
Post Type Selectors

Popular stocks

Crypto

CFD

Currencies

Support

Gold

OIL – Technical Analysis – 4h

August 31, 2025 07:27

Quick Summary

The chart for Crude Oil Futures recently displays a consolidation phase around key levels. With significant candlestick patterns and indicator signals, it provides crucial insights for future movements. The analysis also highlights volume changes and significant support and resistance levels.

Candlestick Analysis

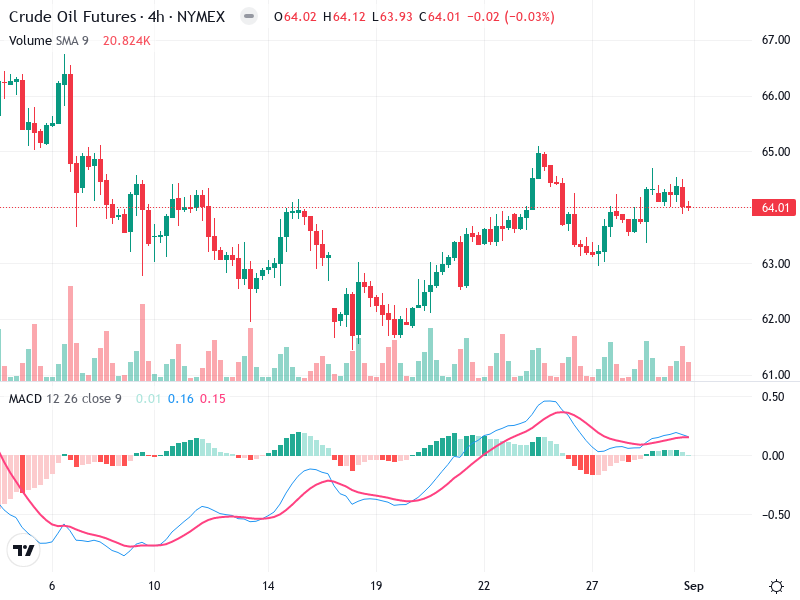
Recently, there's been a series of small-bodied candlesticks near $64, indicating indecision, possibly a Doji or consolidation phase.

Earlier, a bullish engulfing pattern could be seen around August 19th, which led to a subsequent upward move.

Currently sideways, with earlier bullish momentum showing signs of stalling around $64.

MACD Analysis

Recently experienced a bullish crossover, but lines are close, indicating weakening bullish momentum.

Histogram has been slightly positive, but showing signs of tapering off, suggesting momentum is losing steam.

No clear divergence between MACD and price action right now; both are indicating consolidation.

Volume Analysis

Volume has decreased recently as price consolidates around $64, which is typical in sideways markets.

Earlier spikes in volume supported the bullish breakout from $63, but the lack of volume now suggests hesitation in taking the position further up.

Look for any renewed volume spikes for insights into potential breakouts.

Support & Resistance

Key support at $62, tested previously and held firm.

Strong resistance around $65, important for assessing potential breakouts.

These levels are crucial for planning entry and exit strategies, as breaks can signify trend changes.

Actionable Insights

Consider buying on a confirmed break above $65 with increased volume, targeting $67.

Look to sell if price falls and confirms below $62 with a bearish volume increase.

Hold positions until clearer directional signals appear, given current market indecision.

The AI Technical Analysis Center is an informational tool only and does not constitute investment or trading advice.
This site is registered on wpml.org as a development site. Switch to a production site key to remove this banner.