Generic selectors
Exact matches only
Search in title
Search in content
Post Type Selectors

Popular stocks

Crypto

CFD

Currencies

Support

Gold

EUR/USD – Technical Analysis – 4h

September 1, 2025 07:01

Quick Summary

The EUR/USD 4-hour chart displays a significant transition in trend, moving from sideways consolidation to a notable bullish trend. This movement is characterized by a potential breakout scenario that traders should monitor closely.

The emerging bullish momentum is supported by key technical indicators and rising volume, suggesting a shift in market sentiment and possible institutional activity.

Candlestick Analysis

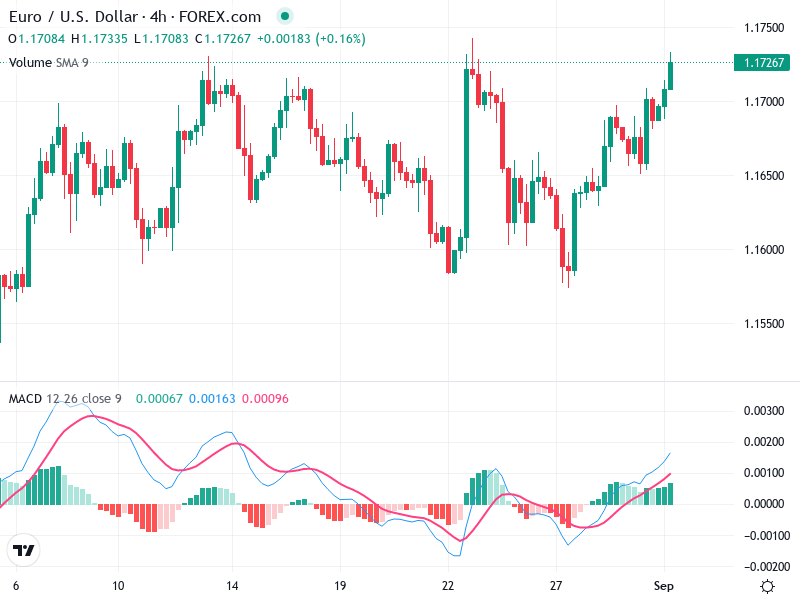
The chart shows a transition from a sideways to a bullish trend. The recent upward movement suggests growing momentum.

Near the end of the chart, a series of bullish candlesticks indicate strong upward movement. Previously, there was sideways consolidation.

The price is testing a possible breakout above 1.1720, which could lead to further gains if sustained.

MACD Analysis

The MACD line has crossed above the Signal line, indicating a bullish crossover. This suggests increasing bullish momentum.

The MACD histogram is in positive territory and expanding, indicating growing upward momentum.

There is no apparent divergence between MACD and price action, supporting the recent upward price movement.

Volume Analysis

There is a noticeable increase in volume during the recent upward movement, suggesting stronger interest and possible institutional activity.

The rising volume supports the current bullish price movements.

This increased volume reinforces the validity of the upward trend.

Support & Resistance

Support Zone: Around 1.1600, which acted as a base during a sideways market.

Resistance Zone: Current level at 1.1720 is a critical resistance.

Breaking above this could open the way to higher levels.

Actionable Insights

Consider buying on a confirmed breakout above 1.1720 with increased volume. Monitor for sustained momentum.

If the price fails to break and hold above 1.1720, consider shorting with targets near 1.1650.

Look for confirmation signals such as sustained volume and continued MACD strength to confirm breakout potential.

The AI Technical Analysis Center is an informational tool only and does not constitute investment or trading advice.
This site is registered on wpml.org as a development site. Switch to a production site key to remove this banner.