Generic selectors
Exact matches only
Search in title
Search in content
Post Type Selectors

Popular stocks

Crypto

CFD

Currencies

Support

Gold

OIL – Technical Analysis – 4h

September 1, 2025 07:09

Quick Summary

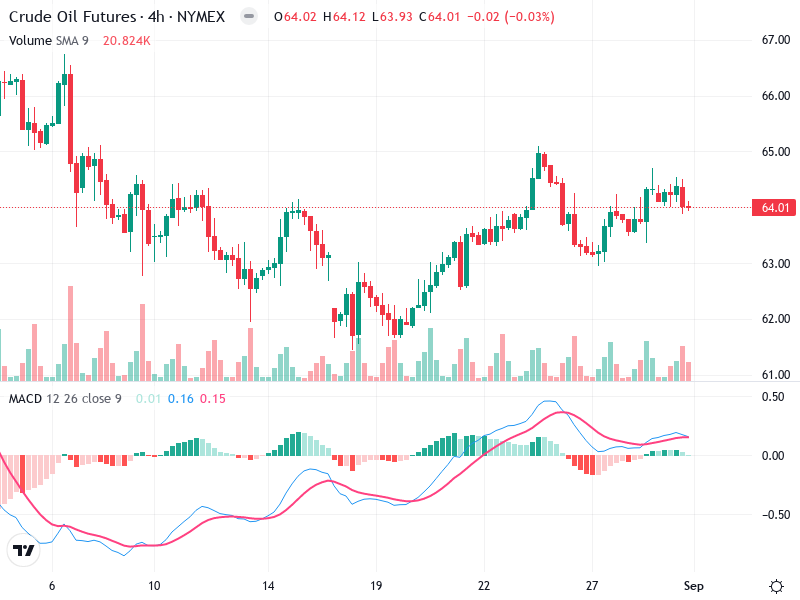
The chart indicates a general uptrend characterized by a sequence of higher lows and higher highs. While no obvious single candlestick pattern is presently distinguished, an overall short-term bullish tendency is evident, despite recent sideways consolidation near $64.

The MACD analysis reveals a slight bullish momentum with the MACD line positioned above the Signal line, and minor positive histogram values pointing to weakening momentum. The absence of significant divergences further reflects this subtle bullishness.

Volume analysis supports the earlier breakout with visible spikes, although a reduction in recent volume indicates consolidation alongside the sideways price action, hinting at possible institutional activities during earlier uptrends.

Candlestick Analysis

The chart shows a series of higher lows and higher highs, indicating a general uptrend.

No major single candlestick pattern like a bullish engulfing or doji is distinctly visible in the latest section.

The chart reflects a short-term bullish trend, with recent consolidation suggesting sideways movement.

MACD Analysis

The MACD line is slightly above the Signal line, suggesting weak bullish momentum.

The histogram shows small positive values, indicating slight upward momentum but also potential diminishing strength.

No significant divergences between the MACD and price action are observed.

Volume Analysis

Volume spikes are visible following the initial breakout upwards, supporting that breakout.

Recent decreased volume suggests consolidation, supporting the sideways price action.

Previous volume spikes align with price increases, suggesting possible institutional buying during those periods.

Support & Resistance

Key support is around $62, where previous resistance turned into support.

The $65 level appears to be the next significant resistance zone.

No other significant support or resistance levels are immediately evident.

Actionable Insights

Consider buying near the support level of $62 if bullish signals appear.

Look to sell or take profits near the $65 resistance unless a breakout occurs with strong volume.

Holding is reasonable as long as the price remains above the $62 level.

The AI Technical Analysis Center is an informational tool only and does not constitute investment or trading advice.
This site is registered on wpml.org as a development site. Switch to a production site key to remove this banner.