Generic selectors
Exact matches only
Search in title
Search in content
Post Type Selectors

Popular stocks

Crypto

CFD

Currencies

Support

Gold

NZD/USD – Technical Analysis – 4h

September 2, 2025 07:04

Quick Summary

This chart provides a comprehensive analysis of the current market conditions for the asset. It reflects both current trends and potential future movements based on several indicators. With a focus on candlestick patterns, MACD, and volume, the analysis aims to offer actionable insights.

The technical analysis helps in identifying key support and resistance levels, offering investors a strategic view of potential entry and exit points.

Candlestick Analysis

There's a noticeable bullish engulfing pattern around August 22, suggesting a potential reversal from the preceding downtrend.

The trend appears to have recently shifted from bearish to sideways, with some bullish momentum after the engulfing pattern.

Resistance is around 0.5920, with support near 0.5840. A breakout above 0.5920 could signal further bullish momentum.

MACD Analysis

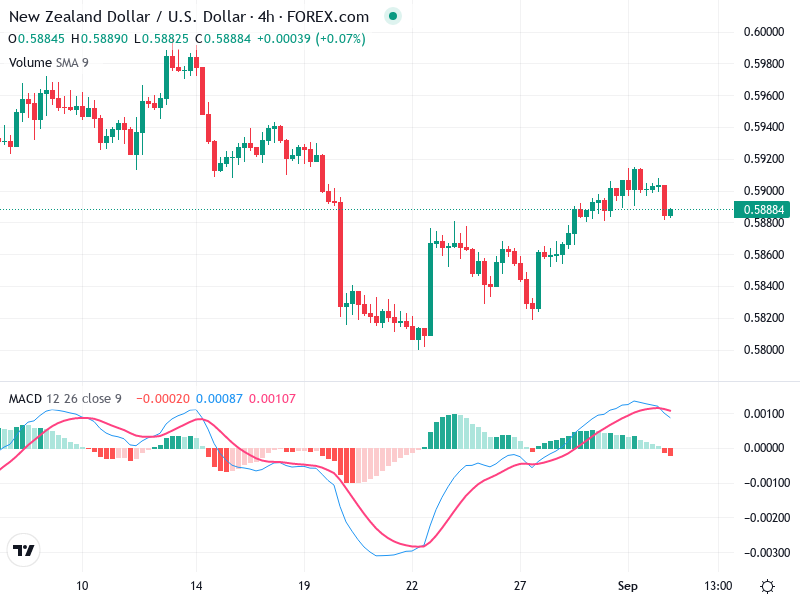
The MACD line (blue) is slightly above the Signal line (red), indicating a recent bullish crossover, but the lines are converging, suggesting weakening bullish momentum.

The histogram shows declining momentum, with bearish bars starting to form, indicating potential forthcoming bearish pressure.

No significant divergence observed currently between MACD and price action.

Volume Analysis

There's a moderate increase in volume during the recent rebound around August 22, supporting the bullish reversal at that time.

The increase in volume coinciding with the upward price suggests the move was somewhat supported, but subsequent lower volume suggests caution.

No significant unusual volume spikes, therefore, no clear indication of institutional activity.

Support & Resistance

Support near 0.5840, acting as a recent bottom.

Resistance around 0.5920, which has been tested multiple times.

A break above resistance could lead to a bullish continuation, while holding support is crucial for maintaining the current range.

Actionable Insights

Consider entry if price breaks above 0.5920 with significant volume, indicating a strong bullish trend.

Watch for a breakdown below 0.5840 with high volume to consider selling positions.

If within the range of 0.5840 to 0.5920, consider holding until a clearer direction is established.

The AI Technical Analysis Center is an informational tool only and does not constitute investment or trading advice.
This site is registered on wpml.org as a development site. Switch to a production site key to remove this banner.