Generic selectors
Exact matches only
Search in title
Search in content
Post Type Selectors

Popular stocks

Crypto

CFD

Currencies

Support

Gold

OIL – Technical Analysis – 4h

September 2, 2025 07:09

Quick Summary

The chart indicates a significant bullish trend with strong upward momentum. A breakout above key resistance levels suggests continued upward movement. Technical indicators and volume patterns align with the current bullish sentiment, pointing towards potential further gains.

Candlestick Analysis

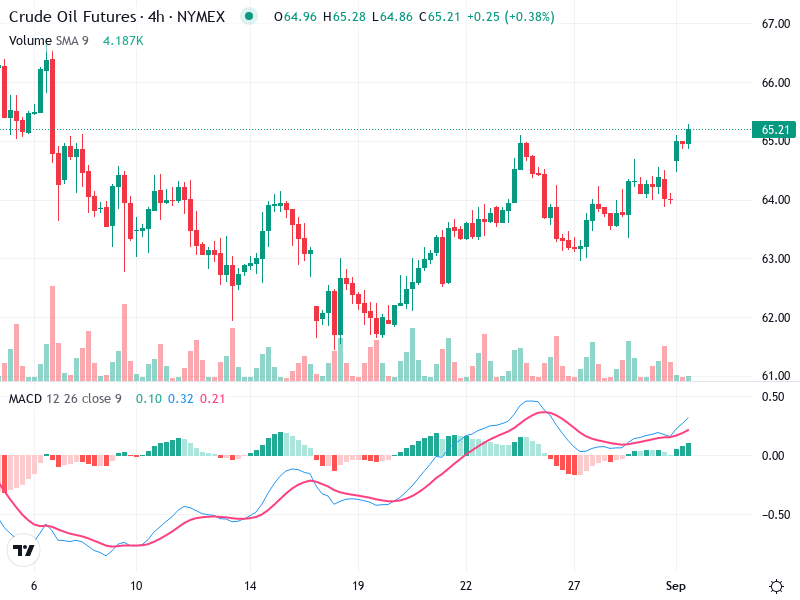
There is a notable bullish engulfing pattern visible on the chart, suggesting a potential reversal from bearish to bullish sentiment.

The trend is currently bullish, as seen by the upward movement in the price and the formation of higher highs.

There is a breakout above a resistance level near 65.00, signaling potential further upward movement.

MACD Analysis

The MACD line is above the Signal line, indicating a bullish crossover.

The MACD histogram shows positive bars that are increasing, reinforcing the bullish momentum.

There is no significant divergence observed between the MACD and the price action, maintaining alignment in bullish sentiment.

Volume Analysis

There has been an increase in volume corresponding with the price rise, supporting the upward move.

Volume is in agreement with the price movements, confirming the bullish breakout.

No unusual spikes suggestive of institutional activity have been noted. Volume remains consistent with the trend.

Support & Resistance

Around 64.00, serving as the recent pullback zone before the upward movement.

Previous resistance has been broken at 65.00, turning it into a new support level.

These levels are critical for determining potential reversal or continuation patterns.

Actionable Insights

Consider buying on a confirmed breakout above 65.50 with a target near previous highs or extending Fibonacci retracement levels.

Maintain positions if already invested, setting a stop-loss below the new support around 64.00.

Keep an eye on volume to ensure it continues to support the upward trend. A decrease could signal a weakening momentum.

The AI Technical Analysis Center is an informational tool only and does not constitute investment or trading advice.
This site is registered on wpml.org as a development site. Switch to a production site key to remove this banner.