Generic selectors
Exact matches only
Search in title
Search in content
Post Type Selectors

Popular stocks

Crypto

CFD

Currencies

Support

Gold

NZD/USD – Technical Analysis – 4h

September 3, 2025 07:05

Quick Summary

The chart displays a recent bearish trend, notably after the price peaked around the 0.5920 level in late August. A series of red candles indicate a downward move. The price appears to hover around identified breakout zones, signaling potential movements.

Candlestick Analysis

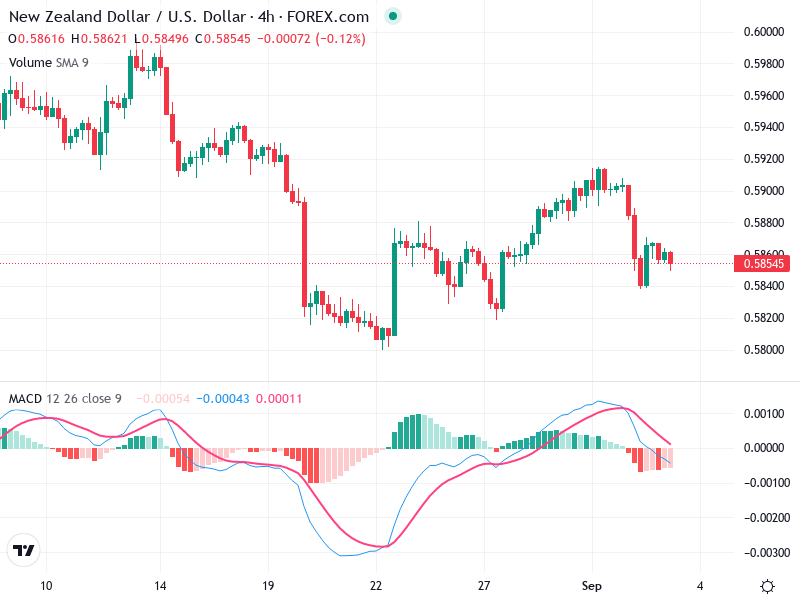
The chart reveals some bearish candlestick structures, notably after the price peaked around the 0.5920 level in late August.

There is a notable series of red candles indicating a recent bearish move.

The trend appears to have been bearish in the short term following a pullback from the highs, reflecting a rejection near the 0.5920 level.

MACD Analysis

The MACD line is moving below the signal line, indicating a bearish crossover.

This suggests that downward momentum is present.

No significant divergences are evident between the MACD and the price, indicating the MACD is confirming the current price trend.

Volume Analysis

Recent volume is moderate; no significant spikes indicate a lack of strong institutional activity or major news driving the market.

The decline in price is accompanied by stable volume, supporting a gradual sell-off rather than panic selling.

No unusual volume spikes, suggesting the market activity is relatively steady.

Support & Resistance

Key support is around 0.5840, which has been tested recently.

Near-term resistance is around 0.5920, where multiple candles indicate failed attempts to break higher.

These levels are critical for determining potential reversals or continuation patterns.

Actionable Insights

Consider selling on rallies towards the 0.5920 resistance unless a clear breakout occurs.

Consider holding if trading within the established range of 0.5840 to 0.5920, watching for breakouts.

Observe for potential MACD crossover change for bullish indications or volume spikes signaling stronger moves.

The AI Technical Analysis Center is an informational tool only and does not constitute investment or trading advice.
This site is registered on wpml.org as a development site. Switch to a production site key to remove this banner.