Generic selectors
Exact matches only
Search in title
Search in content
Post Type Selectors

Popular stocks

Crypto

CFD

Currencies

Support

Gold

AUD/USD – Technical Analysis – 4h

September 3, 2025 07:06

Quick Summary

The chart exhibits a recent transition from a downtrend to a sideways movement, suggesting consolidation.

Significant patterns, volume changes, and MACD signals are crucial in understanding the potential next moves.

Candlestick Analysis

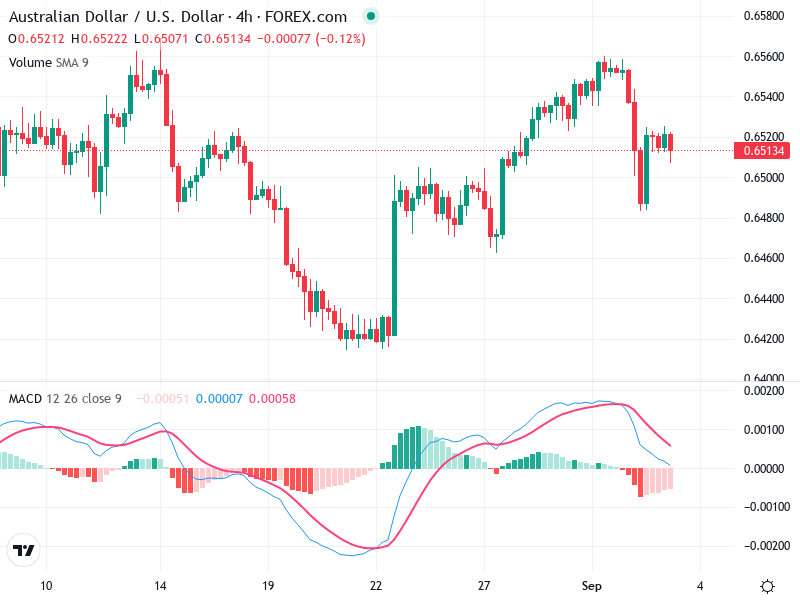
A notable bullish engulfing pattern occurred after the downtrend on the 21st, signaling a possible reversal to the upside.

Recent candles display indecision with several doji formations, indicating potential consolidation near the current price.

Recent highs around 0.6550 could represent a breakout zone, while levels between 0.6480 and 0.6500 have provided both support and resistance in the past.

MACD Analysis

The MACD line is below the Signal line, indicating a bearish crossover suggesting waning momentum.

The histogram is transitioning from positive to negative, reinforcing potential bearish sentiment in the short term.

No clear divergence is noted between MACD and price action currently.

Volume Analysis

There's a notable increase in volume around the initial bullish reversal, but current levels have decreased, indicative of consolidation.

Declining volume as the price moves sideways suggests a lack of strong conviction, indicating potential accumulation or distribution.

Volume spikes accompanying the initial bullish move suggest possible institutional buying or short covering.

Support & Resistance

Support is noted at 0.6440 and 0.6480, which are crucial levels to monitor for breakout or reversal signals.

Resistance is identified at 0.6550 and 0.6530, with a decisive move beyond these levels indicating trend continuation or reversal.

These levels should be closely watched for further breakout or reversal signals.

Actionable Insights

Consider buying on a confirmed breakout above 0.6550 with strong volume for potential gains.

Short positions might be viable if the price fails to sustain above 0.6500 and a bearish confirmation emerges below 0.6480.

Holding might be advisable given current indecision until clearer signals arise from key support and resistance levels.

The AI Technical Analysis Center is an informational tool only and does not constitute investment or trading advice.
This site is registered on wpml.org as a development site. Switch to a production site key to remove this banner.