Generic selectors
Exact matches only
Search in title
Search in content
Post Type Selectors

Popular stocks

Crypto

CFD

Currencies

Support

Gold

OIL – Technical Analysis – 4h

September 3, 2025 07:09

Quick Summary

The Crude Oil Futures chart, on a 4-hour timeframe, shows a recent consolidation phase following a bullish run. Key levels of support and resistance are maintaining the current trading range. Traders should be watchful for breakout opportunities in either direction.

Candlestick Analysis

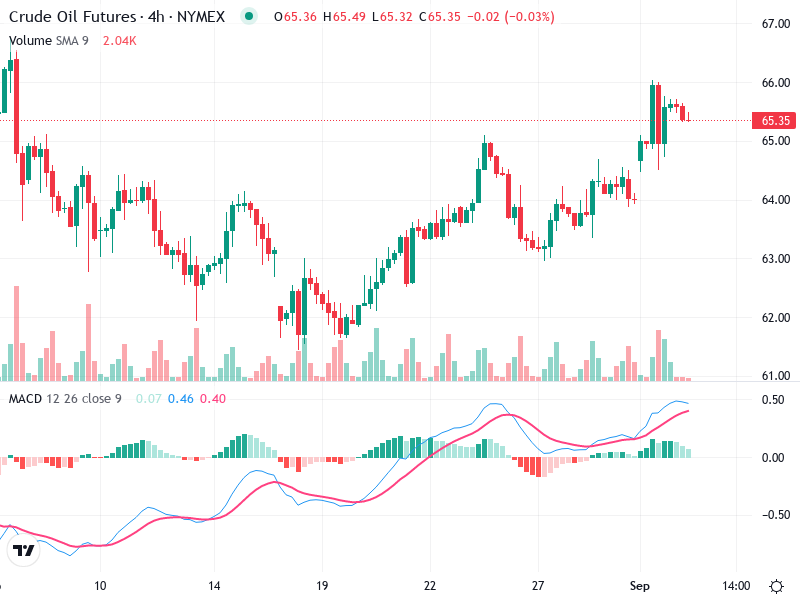
The overall trend appears to be bullish, with a series of higher highs and higher lows from mid-August to early September.

There is a noticeable pullback after a strong bullish movement around the end of August, with recent candlesticks suggesting consolidation and market indecision.

A small bearish candlestick pattern appears at the current resistance, suggesting potential weakness.

MACD Analysis

The MACD line is slightly above the signal line, indicating weak bullish momentum, although the lines are converging.

The MACD histogram shows reducing bullish momentum as the bars shrink, suggesting a potential reversal or consolidation phase.

No significant divergences are noticeable between MACD and price action at this stage.

Volume Analysis

There are spikes in volume coinciding with the bullish breakout at the end of August, which supports the upward move.

The volume has tapered off slightly during the consolidation phase, suggesting a lack of strong buying interest.

The previous spike may indicate some institutional participation, but current volume does not suggest aggressive selling or buying.

Support & Resistance

Immediate resistance is around the 66.00 mark, which coincided with recent highs.

Immediate support is around 64.50 to 65.00 levels, based on previous swing lows and consolidation zones.

Key levels are maintaining the current trading range and should be watched for breakout opportunities.

Actionable Insights

Consider buying if the price breaks above the 66.00 resistance with increased volume, indicating continuation of the bullish trend.

Sell if the price breaks below 64.50 with increased volume, as this could indicate a trend reversal or deeper pullback.

Traders currently holding long positions might consider maintaining them with a trailing stop below 64.50 to protect against sudden reversals.

The AI Technical Analysis Center is an informational tool only and does not constitute investment or trading advice.
This site is registered on wpml.org as a development site. Switch to a production site key to remove this banner.