Generic selectors
Exact matches only
Search in title
Search in content
Post Type Selectors

Popular stocks

Crypto

CFD

Currencies

Support

Gold

GOLD – Technical Analysis – 4h

September 4, 2025 07:04

Quick Summary

The analysis of the 4-hour chart for gold Futures reveals nuanced insights into recent market dynamics.

A predominantly bullish trend faces slight consolidation challenges, hinting at potential corrective phases in the near term.

Traders are advised to monitor key support and resistance levels for decisive price action.

Candlestick Analysis

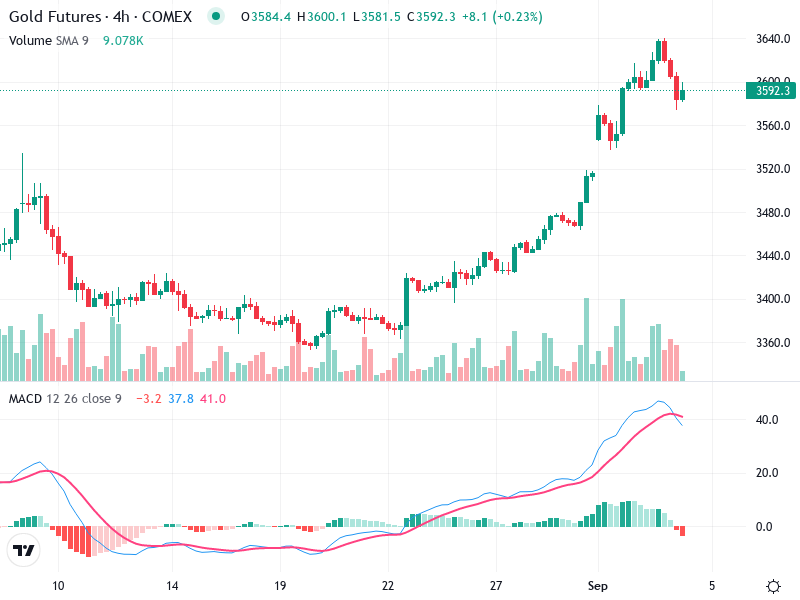
Recently, there appears to be a small red candlestick following several large green candlesticks, suggesting a potential pause or reversal.

The trend has been predominantly bullish, with a series of higher highs and higher lows leading up to the current price.

There was a breakout past the 3480.0 level, with the current price pulling back slightly around the 3600.0 level, indicating potential consolidation or a pullback area.

MACD Analysis

A bearish crossover is occurring as the MACD line crosses below the Signal line, suggesting potential bearish momentum.

The histogram bars have moved into negative territory, reinforcing the bearish crossover and indicating diminishing bullish momentum.

No significant divergence is evident between MACD and the price action at the current moment.

Volume Analysis

Volume spiked noticeably during the upward price movement, supporting the recent bullish trend.

The declining volume as the price consolidates suggests a potential slowdown in buying pressure.

The spike could indicate institutional buying interest during the upward move.

Support & Resistance

Immediate support is around the 3560.0 level, which aligns with prior consolidation.

The 3600.0 area acts as current resistance, with a more significant resistance level near 3640.0 based on previous highs.

The identified support and resistance levels are critical as they could dictate future price action, whether holding as support or breaking as resistance.

Actionable Insights

Consider entering long positions if the price rebounds from the support at 3560.0 with strong volume, confirmed by bullish candlesticks.

Watch for a confirmed break below the 3560.0 support with an increase in volume to consider short positions.

If already in a long position, observe how the price consolidates around the current level and the reaction to the MACD signal.

The AI Technical Analysis Center is an informational tool only and does not constitute investment or trading advice.
This site is registered on wpml.org as a development site. Switch to a production site key to remove this banner.