Generic selectors
Exact matches only
Search in title
Search in content
Post Type Selectors

Popular stocks

Crypto

CFD

Currencies

Support

Gold

NZD/USD – Technical Analysis – 4h

September 4, 2025 07:05

Quick Summary

The analysis of the chart reveals a transition in market sentiment.

Recent movements indicate a potential shift in trend direction.

Candlestick Analysis

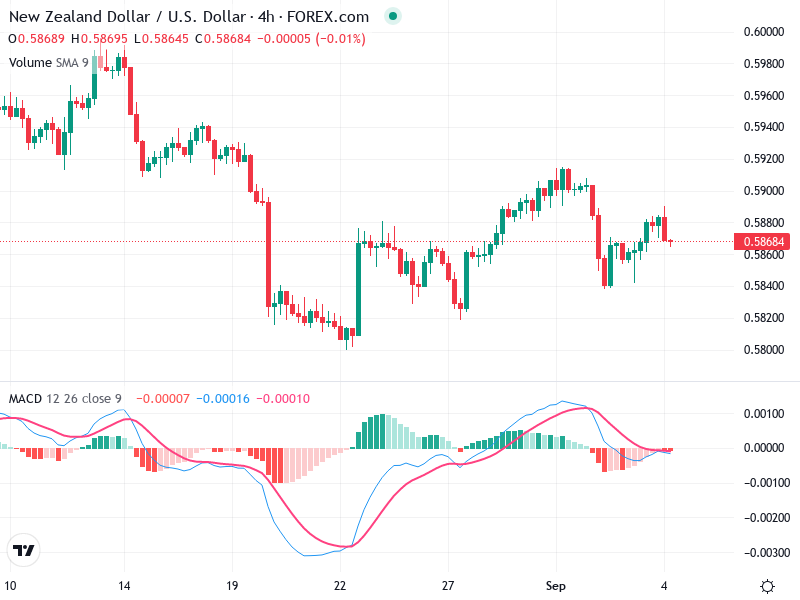
The overall trend for this chart appears to be transitioning from a downtrend to a potential sideways or slight uptrend.

The recent upward movement followed by consolidation suggests uncertainty in direction.

There is a noticeable bullish green candlestick around August 22, indicating a reversal from the previous downtrend.

MACD Analysis

The MACD line is above the Signal line, indicating a bullish crossover which occurred recently.

This is generally a positive sign of potential upward momentum.

No strong divergence is apparent between the MACD and price.

Volume Analysis

Volume seems relatively stable with some increase during significant price changes.

The lack of significant volume spikes during recent price movements suggests the absence of strong institutional activity.

No unusual volume spikes are evident, indicating that major buy/sell actions have not occurred recently.

Support & Resistance

Around the 0.58300 level, where the price found support after initial declines.

At approximately 0.58800, this level previously acted as resistance.

A close above this level with volume confirmation could validate a breakout.

Actionable Insights

Current strategies could include holding positions for those already long.

Watching for confirmation of a breakout above 0.58800 for new buy entries.

Consider tight stop-loss below recent support at 0.58300.

The AI Technical Analysis Center is an informational tool only and does not constitute investment or trading advice.
This site is registered on wpml.org as a development site. Switch to a production site key to remove this banner.