The chart reveals a potential trend reversal prompted by a notable candlestick pattern. A recent sideways movement accompanied by specific volume changes requires close monitoring. Analysts should stay vigilant for shifts in price behavior near key levels.
Candlestick Analysis
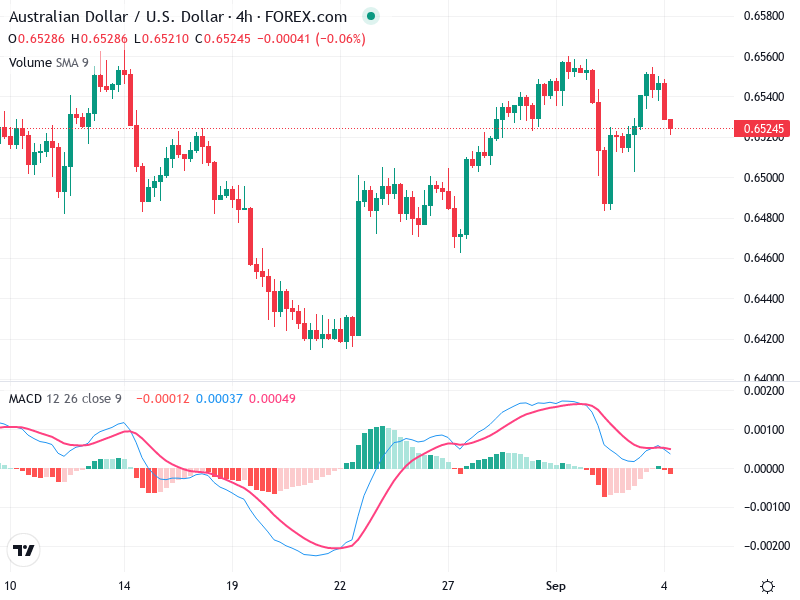
There is a visible bullish engulfing pattern suggesting potential reversal.
The recent candlesticks show a slight bearish tone with lower highs.
The resistance around 0.6560 level is now acting as a pullback zone.
MACD Analysis
The MACD line has crossed below the Signal line, indicating a bearish crossover.
The histogram shows decreasing bullish momentum towards the zero line.
Recent crossover indicates bearish pressure despite no significant divergence.
Volume Analysis
Recent decrease in volume suggests lack of strong interest in current movement.
Volume during the pullback indicates lack of conviction in price drop.
Earlier volume spike may indicate institutional activity with large bullish candle.
Support & Resistance
Key support at 0.6500, tested multiple times.
Resistance at 0.6560, which the price struggled to break.
Support and resistance zones are critical for reversal or breakout plays.
Actionable Insights
Consider buying near support level of 0.6500 with bullish confirmation.
Potential selling if price fails to hold above 0.6560.
Monitor for volume increases to validate price moves.
The AI Technical Analysis Center is an informational tool only and does not constitute investment or trading advice.