Generic selectors
Exact matches only
Search in title
Search in content
Post Type Selectors

Popular stocks

Crypto

CFD

Currencies

Support

Gold

NSDQ – Technical Analysis – 4h

September 5, 2025 07:00

Quick Summary

The chart indicates a recent uptrend after a period of correction. A potential breakout zone has been identified, suggesting further upward movement could be on the horizon if certain levels are breached.

Current indicators show a cautious sentiment, with volume playing a key role in confirming any potential trend continuation.

Candlestick Analysis

Recent candlesticks reveal a strong green candlestick succeeding mixed candles, indicating possible bullish momentum.

The chart depicts an initial upward trend, followed by a correction and a recent attempt to resume the uptrend.

A breakout could occur above the recent peaks around 23,750, signaling potential upward movement.

MACD Analysis

The MACD line is converging towards the Signal line following a bullish crossover, suggesting possible upward momentum.

The histogram displays decreasing negative values, indicating weakening bearish momentum and a potential shift to bullish sentiment.

No clear divergence between the MACD and price action is evident at this moment.

Volume Analysis

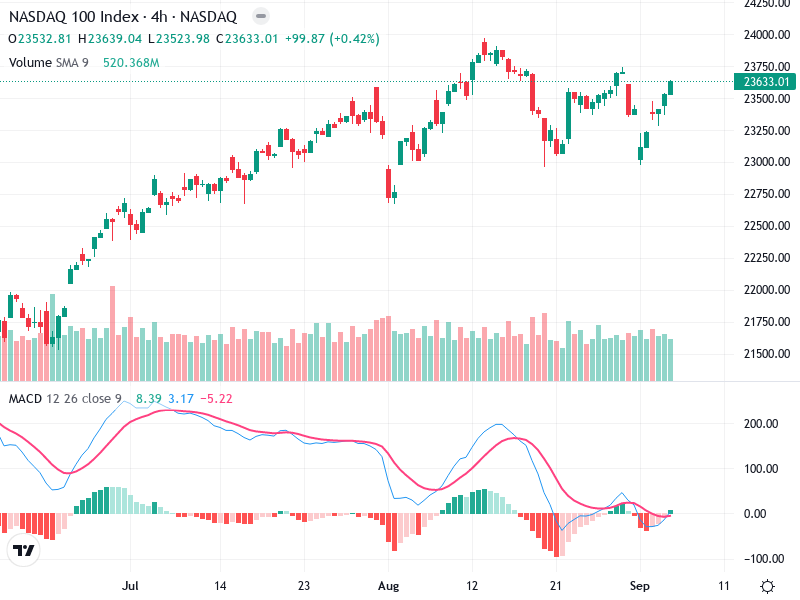
Volume spikes during recent downward movements suggest strong selling pressure, though recent volumes remain average, lacking significant support for bullish candles.

Recent volume provides insufficient support for the bullish move, warranting caution.

Previous sell-offs featured higher volumes, suggesting institutional selling activity.

Support & Resistance

The area around 23,000 has been acting as a support level.

Approximately 23,750 serves as a resistance level, significant for potential breakout confirmation.

Breaking past the resistance could confirm the continuation of the uptrend.

Actionable Insights

Consider buying if the price breaks above 23,750 with strong volume, and watch for a bullish MACD confirmation.

Look out for continued bullish MACD crossover and increased buying volume for confirmation of the trend.

Be aware of potential risks; failure to breach resistance or weak volume may lead to sideways movement or further pullbacks.

The AI Technical Analysis Center is an informational tool only and does not constitute investment or trading advice.
This site is registered on wpml.org as a development site. Switch to a production site key to remove this banner.