Generic selectors
Exact matches only
Search in title
Search in content
Post Type Selectors

Popular stocks

Crypto

CFD

Currencies

Support

Gold

GOLD – Technical Analysis – 4h

September 5, 2025 07:03

Quick Summary

The chart highlights significant movements in with key trends and patterns emerging over recent months. From mid-August, the asset has shown a noticeable uptrend, marked by higher highs and higher lows. However, recent consolidation suggests indecision at the current resistance level, prompting close monitoring for further developments.

Candlestick Analysis

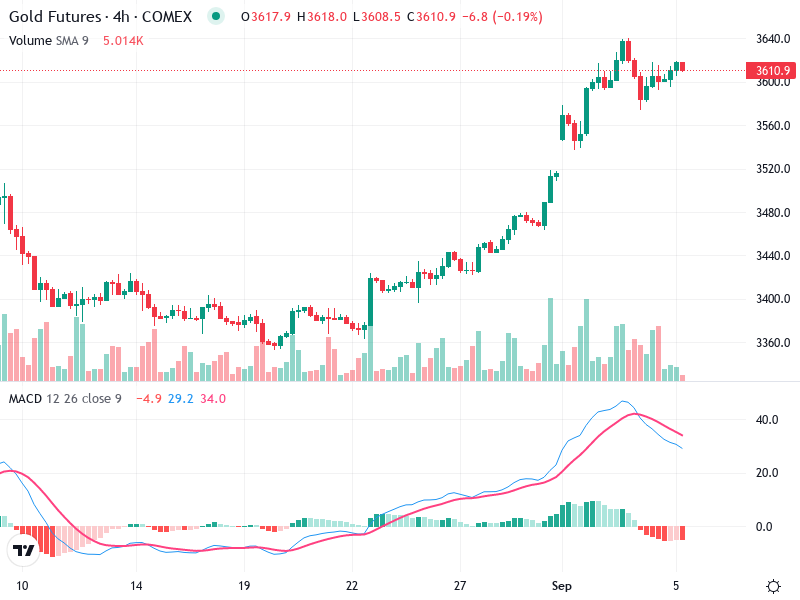
The chart shows a strong bullish trend, particularly from mid-August onward, with a series of higher highs and higher lows.

In the recent uptrend, there aren't any major reversal patterns visible, but note the consolidation at the top indicating potential indecision.

There was a breakout around August 25th with a significant upward movement that carried through into early September.

MACD Analysis

There's a bearish crossover visible, where the MACD line has crossed below the Signal line, suggesting decreasing momentum.

The declining histogram bars indicate weakening bullish momentum, which aligns with the recent consolidation.

Currently, there is no clear divergence between MACD and price action.

Volume Analysis

Volume increased significantly during the breakout and upward trend around August 25th, supporting the price rise.

There's a decrease in volume as the price consolidates at the top, indicating a lack of strong selling pressure or conviction among buyers.

The initial volume spike could suggest institutional participation during the bullish run.

Support & Resistance

Key support is around 3480, which aligns with the previous range before the breakout.

Current resistance is around 3640, where the price seems to be consolidating after the extended uptrend.

The recent consolidation at resistance could be a precursor to either a breakout or a pullback.

Actionable Insights

Given the potential bearish crossover and declining momentum, consider profit-taking or a hold strategy. A breakout above 3640 with volume could provide a buying opportunity.

Watch for confirmation of the bearish crossover with sustained volume decrease, or reversal patterns near resistance.

The recent strong uptrend followed by consolidation might indicate a bullish market but currently facing exhaustion.

The AI Technical Analysis Center is an informational tool only and does not constitute investment or trading advice.
This site is registered on wpml.org as a development site. Switch to a production site key to remove this banner.