Generic selectors
Exact matches only
Search in title
Search in content
Post Type Selectors

Popular stocks

Crypto

CFD

Currencies

Support

Gold

EUR/USD – Technical Analysis – 4h

September 8, 2025 07:02

Quick Summary

The EUR/USD 4-hour chart indicates a strong bullish trend with recent price increases. The presence of higher highs and higher lows further supports the upward momentum.

Technical indicators such as MACD and volume analysis reinforce the current bullish view, providing confidence in sustained price movements.

Candlestick Analysis

The chart shows a bullish trend following the recent price increase, characterized by higher highs and higher lows.

A strong bullish candlestick towards the end suggests continued buying interest, affirming the uptrend.

The appearance of a bullish engulfing pattern earlier indicates a reversal from a downtrend to an uptrend, signifying a change in momentum.

MACD Analysis

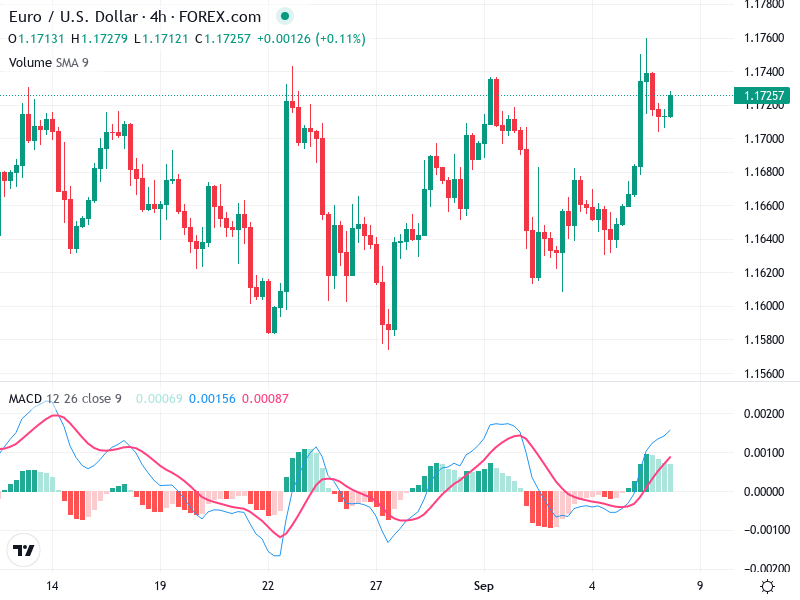
The MACD line is above the Signal line, indicating bullish momentum, with a recent crossover suggesting potential continuation.

The positive and increasing MACD histogram supports the bullish momentum, indicating upward price pressure.

No obvious divergences between MACD and price action are seen, supporting trend sustainability.

Volume Analysis

The rise in volume corresponds with recent bullish movement, confirming the price move's authenticity.

No contradictions are observed between volume and price movement at this point.

A notable volume spike with the recent bullish candlestick indicates possible institutional buying.

Support & Resistance

Resistance is around 1.1750, a break above could lead to further gains.

Support is approximately 1.1600, a drop below this could signal a potential downside reversal.

Testing these levels will be crucial for determining future price direction.

Actionable Insights

Consider buying on a confirmed break above 1.1750, with volume support fortifying the decision.

Look for price rejection around resistance levels or bearish patterns as signals for short positions.

If already long, monitor for signs of weakening momentum before opting to sell.

The AI Technical Analysis Center is an informational tool only and does not constitute investment or trading advice.
This site is registered on wpml.org as a development site. Switch to a production site key to remove this banner.