Generic selectors
Exact matches only
Search in title
Search in content
Post Type Selectors

Popular stocks

Crypto

CFD

Currencies

Support

Gold

AUD/USD – Technical Analysis – 4h

September 8, 2025 07:07

Quick Summary

The chart analysis of the Australian Dollar/U.S. Dollar reveals a predominantly bullish trend on the 4-hour timeframe. From August 22 onwards, the pair has been experiencing higher highs and higher lows. A recent breakout above the 0.6570 level solidifies the bullish momentum.

Candlestick Analysis

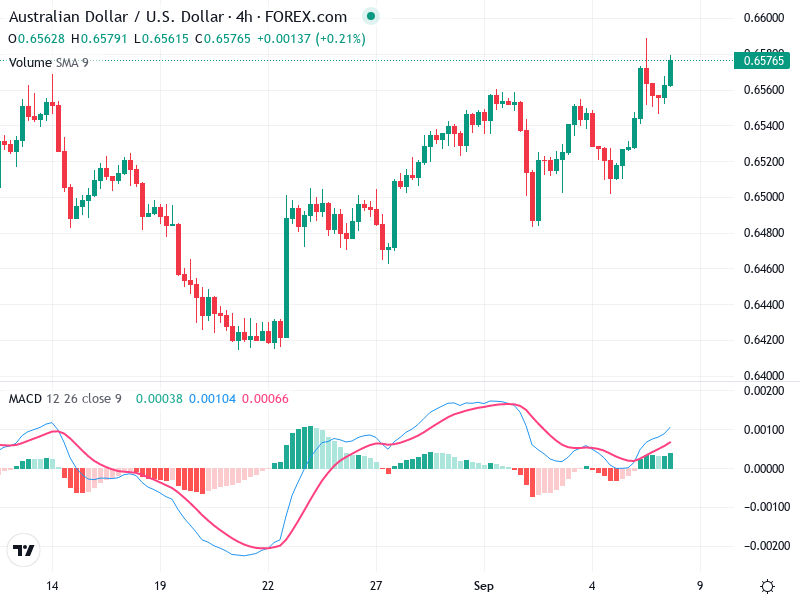
The chart does not currently display any classic candlestick patterns such as a bullish engulfing or doji. However, there are strong green candles suggesting bullish movements.

The overall trend appears bullish, with a series of higher highs and higher lows from August 22 onwards.

The recent price action suggests a breakout above the 0.6570 level, indicating potential continuation of the uptrend if confirmed by subsequent candles.

MACD Analysis

The MACD line (blue) is above the Signal line (red), indicating a bullish crossover.

The histogram is in positive territory, supporting the momentum to the upside.

No apparent divergences are visible at the moment, as both MACD and price move upwards.

Volume Analysis

There is no significant spike in volume, suggesting a lack of strong institutional activity.

Volume is relatively stable; thus, it does not provide strong confirmation or contradiction of the price movement.

No major volume anomalies suggest that recent price actions are not driven by unusual activity.

Support & Resistance

Key support exists around the 0.6500 level, where previous consolidation occurred.

The recent breakout past 0.6570 is crucial, with the next resistance likely around 0.6600.

Support and resistance levels play a crucial role in guiding future price movements for the AUD/USD.

Actionable Insights

If the price sustains above 0.6570 with increased volume and continued MACD bullish crossover, a buy strategy could be considered.

If the price falls back below 0.6500, with a bearish MACD crossover, it could signal potential selling opportunities.

Traders currently holding positions might consider holding if the trend continues bullish without significant resistance challenges.

The AI Technical Analysis Center is an informational tool only and does not constitute investment or trading advice.
This site is registered on wpml.org as a development site. Switch to a production site key to remove this banner.