Generic selectors
Exact matches only
Search in title
Search in content
Post Type Selectors

Popular stocks

Crypto

CFD

Currencies

Support

Gold

GBP/USD – Technical Analysis – 4h

September 8, 2025 07:09

Quick Summary

The GBP/USD 4-hour chart presents an emerging bullish trend, reflecting a recovery from previous declines. Technical indicators suggest a continuation of this upward momentum, with potential key levels identified for strategic entry and exit points.

Price action has shown signs of increased bullish activity, indicating a favorable environment for traders looking to capitalize on upward movements in this forex pair.

Candlestick Analysis

The chart shows a recent shift from a bearish to a more bullish trend as prices have bounced back after the decline.

A noticeable bullish engulfing pattern appears, indicating potential strong upside momentum after a preceding downtrend.

The recent candles indicate higher lows, suggesting a potential upward trend establishment.

MACD Analysis

A bullish crossover is evident as the MACD line crosses above the Signal line, suggesting rising bullish momentum.

The histogram is increasing, reinforcing the emerging bullish momentum.

There are no clear divergences observed between MACD and price action currently.

Volume Analysis

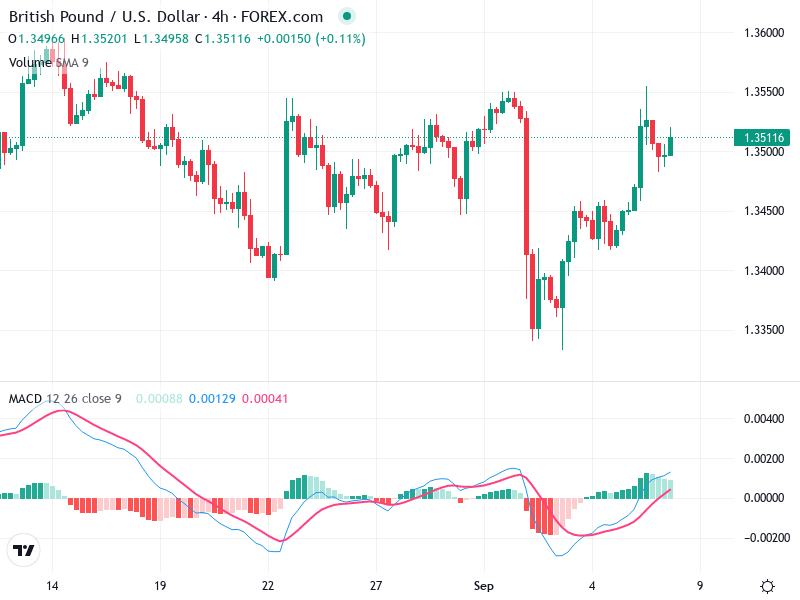
Volume generally supports the upward move with modest spikes during the price increase, implied institutional interest.

No unusual spikes noted that aren't aligned with price changes, suggesting steady trader engagement without excessive speculation.

The consistent volume trends back the bullish price action, indicating healthy market participation.

Support & Resistance

Around 1.3500: Recently turned support, crucial for maintaining the current bullish trend.

Near 1.3550-1.3560: Previous highs, breaking this level could signal further upward momentum.

The support and resistance levels provide clear markers for potential price reaction zones.

Actionable Insights

Consider entering long positions on pullbacks towards 1.3500 if confirmed as support.

Look for further breakouts above 1.3550 for additional upward moves.

Holding is advisable for ongoing long positions with a stop-loss slightly below the 1.3500 support.

The AI Technical Analysis Center is an informational tool only and does not constitute investment or trading advice.
This site is registered on wpml.org as a development site. Switch to a production site key to remove this banner.