Generic selectors
Exact matches only
Search in title
Search in content
Post Type Selectors

Popular stocks

Crypto

CFD

Currencies

Support

Gold

GOLD – Technical Analysis – 4h

September 8, 2025 07:12

Quick Summary

The gold Futures chart shows a prevailing bullish trend supported by several technical indicators. The price movement is characterized by higher highs and lows, indicating strong upward momentum. Key resistance and support levels are identified for strategic trading opportunities.

Candlestick Analysis

The overall trend is bullish, evident from the series of higher highs and higher lows. The price is consistently climbing with a strong bullish momentum.

Several strong bullish candles, like Bullish Marubozu, indicate continuous buying pressure. Slight pullbacks serve as brief consolidations before continuation of the uptrend.

No significant breakout pattern is immediately visible, as the current trend is sustaining.

MACD Analysis

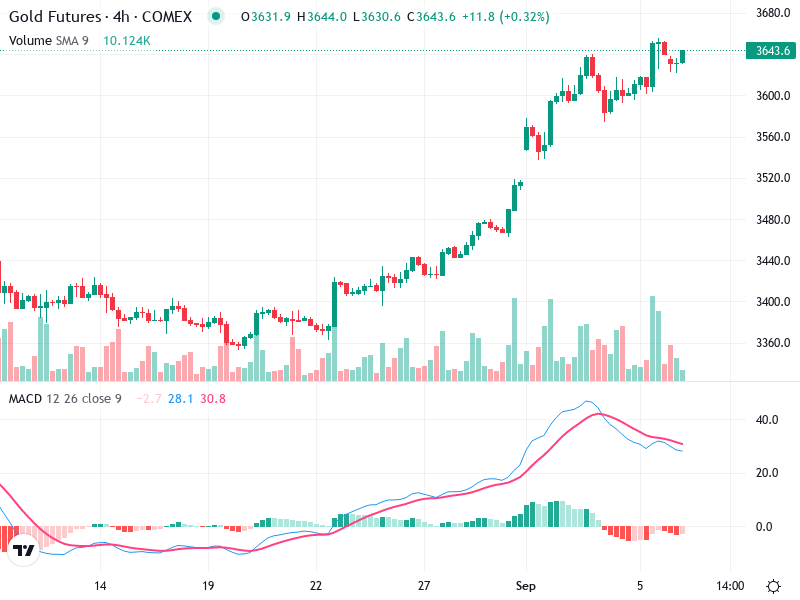
The MACD line is above the signal line, supporting a bullish sentiment. However, it's beginning to converge, suggesting potential reduced momentum.

The histogram is currently showing a decreasing positive momentum, indicating a possible slowdown in the uptrend. Close observation is needed to watch for any crossover that might signal a trend reversal.

No clear divergence between the MACD and price action at this point.

Volume Analysis

Increasing volume on upward moves suggests strong buying interest. Volume peaks align with substantial price increases.

Unusual spikes in volume coincide with larger price movements, potentially indicating institutional buying.

Monitoring volume trends is crucial for confirming the strength of the upward momentum.

Support & Resistance

The area around 3644 is a critical resistance level. A clear breakout above this may lead to further bullish moves.

Initial support around 3480-3500, where previous consolidations occurred. Below that, further support around 3360.

Identifying these levels provides strategic entry and exit points for traders.

Actionable Insights

Consider buying on pullbacks near the support level of 3500, with a stop loss below 3480.

A confirmed breakout above 3644 with volume could be an opportunity to enter a long position.

Look for a bullish MACD crossover and increasing volume on upward moves as confirmation for entry.

The AI Technical Analysis Center is an informational tool only and does not constitute investment or trading advice.
This site is registered on wpml.org as a development site. Switch to a production site key to remove this banner.