Generic selectors
Exact matches only
Search in title
Search in content
Post Type Selectors

Popular stocks

Crypto

CFD

Currencies

Support

Gold

NSDQ – Technical Analysis – 4h

September 9, 2025 07:00

Quick Summary

This analysis provides insights into the recent performance of the asset, focusing on potential future movements.

has shown promising trends recently, prompting interest from various market participants.

Candlestick Analysis

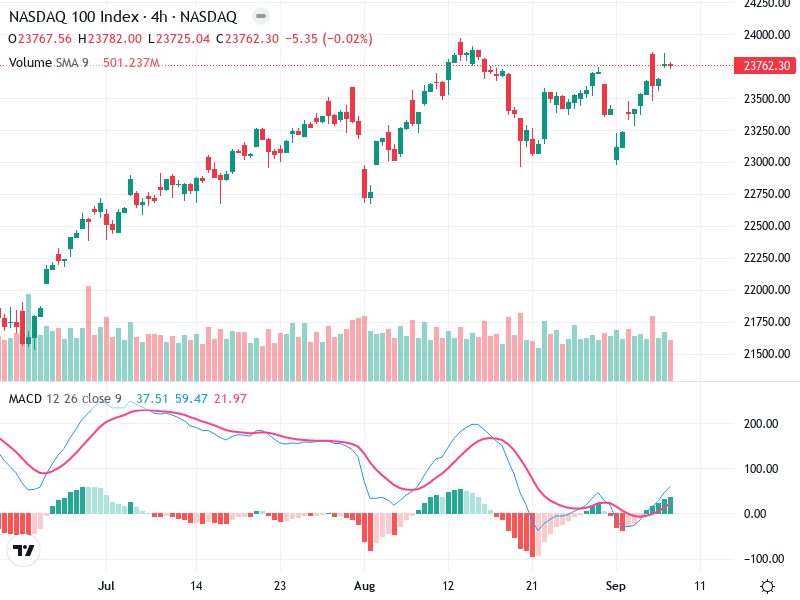
The recent candlestick pattern shows an upward movement, indicating potential bullish momentum.

Note the occurrence of a possible bullish engulfing pattern in early August, suggesting previous upward pressure.

The chart shows a generally bullish trend, with higher highs and higher lows since late July.

MACD Analysis

The MACD line crossed above the Signal line recently, indicating a bullish crossover.

The histogram is positive and increasing, suggesting increasing bullish momentum.

No significant divergences are noticeable between MACD and price action.

Volume Analysis

Volume has been moderate with occasional spikes.

The recent upward movement is accompanied by a slight increase in volume.

A noticeable spike in early August corresponds with a significant upward price movement, potentially indicating institutional activity.

Support & Resistance

Resistance: Around 24,000

Support: Approximately 23,000

A break above resistance can signal a significant bullish trend reversal.

Actionable Insights

Consider buying if the price breaks above the 24,000 resistance with strong volume.

Watch for bearish reversals near current resistance if unable to break through.

If holding, ensure stop-loss orders are set slightly below key support to protect against downside risk.

The AI Technical Analysis Center is an informational tool only and does not constitute investment or trading advice.
This site is registered on wpml.org as a development site. Switch to a production site key to remove this banner.