Generic selectors
Exact matches only
Search in title
Search in content
Post Type Selectors

Popular stocks

Crypto

CFD

Currencies

Support

Gold

OIL – Technical Analysis – 4h

September 9, 2025 07:11

Quick Summary

The asset shows promising movements as indicated on the chart.

The analysis highlights recent changes in support and resistance levels.

Overall, it suggests a potential shift in market direction.

Candlestick Analysis

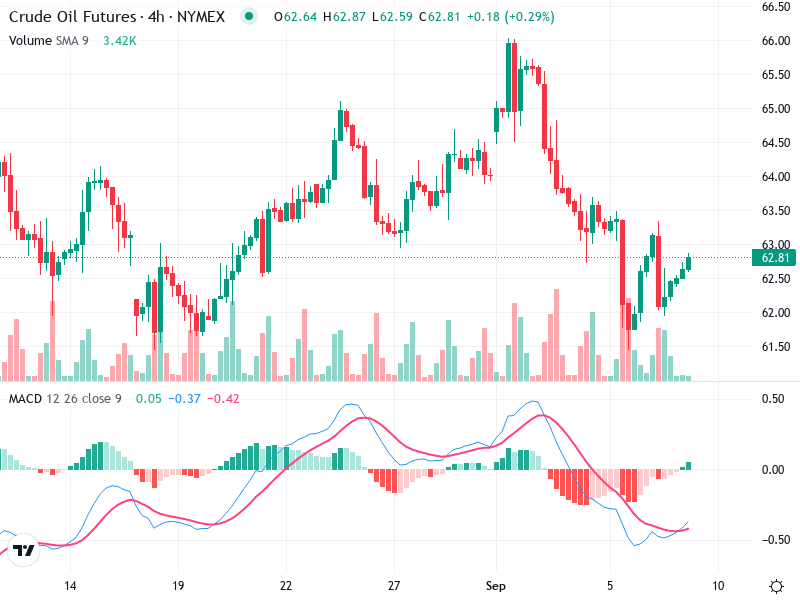
Recently, there is a noticeable upward movement with several bullish candlesticks, indicating a potential recovery from a previous downtrend.

No notable reversal patterns like a bullish engulfing or hammer near the current price, but there is some bullish momentum building.

The chart shows a recent bearish trend with a possible shift to a sideways or slight bullish trend as indicated by recent candlesticks.

MACD Analysis

The MACD line has crossed above the Signal line, indicating a potential bullish crossover. This suggests bullish momentum may be building.

The histogram is transitioning from negative to positive, supporting the potential bullish sentiment.

No obvious divergence between MACD and price action currently visible that suggests impending reversal from the present move.

Volume Analysis

There is a noticeable spike in volume accompanying the recent bullish candlesticks, suggesting strong buying interest.

The increased volume on bullish days supports the recent price increase, indicating the move might be sustainable.

Look for large volume bars, which can indicate institutional action; volume appears moderately strong but not unusually spiked.

Support & Resistance

Support: Near $62.50

Resistance: Near $63.00 to $63.50

A break above the $63.00-$63.50 resistance could signal further bullishness. The support at $62.50 is crucial to maintain a bullish stance.

Actionable Insights

Consider a buy if the price breaks and holds above the $63.00 resistance with continued volume support.

A hold if the price continues to move sideways without any significant volume increase.

A sell if the price breaks below the $62.50 support with increased volume.

The AI Technical Analysis Center is an informational tool only and does not constitute investment or trading advice.
This site is registered on wpml.org as a development site. Switch to a production site key to remove this banner.