Generic selectors
Exact matches only
Search in title
Search in content
Post Type Selectors

Popular stocks

Crypto

CFD

Currencies

Support

Gold

EUR/USD – Technical Analysis – 4h

September 10, 2025 07:02

Quick Summary

The EURO /U.S. Dollar chart on a 4-hour timeframe exhibits significant activity.

The recent bearish movements and technical indicators suggest noteworthy trends and potential trading opportunities.

Candlestick Analysis

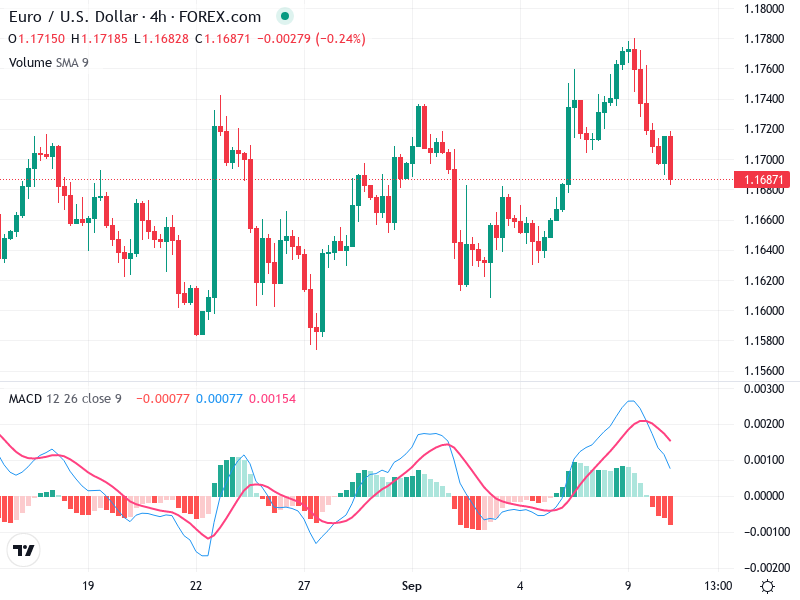
The recent large bearish candlestick indicates selling pressure.

Prior to this, there was a bearish engulfing pattern suggesting a reversal from the recent upward movement.

Currently, the trend appears to be bearish in the short term, following a peak near 1.1780.

MACD Analysis

The MACD line has crossed below the Signal line, indicating a bearish crossover.

The histogram moving below zero suggests increasing bearish momentum.

No clear divergence observed at the moment, but recent price action confirms bearish sentiment alongside MACD signals.

Volume Analysis

A noticeable increase in volume accompanied the recent price decrease, supporting the bearish trend.

The increasing volume during the price decline suggests strong seller activity.

No extraordinary spikes beyond usual fluctuations, but consistent with the downtrend.

Support & Resistance

Immediate support is evident around 1.1680.

If this level is breached, the next significant support could be around 1.1600.

Resistance is near 1.1760, where prior peaks have formed.

Actionable Insights

If price breaks below 1.1680 with volume confirmation, consider sell positions.

Look for buy confirmations near 1.1600 if price rebounds.

Watch for further confirmation of the bearish crossover on the MACD, and movements around the 1.1680 support level.

The AI Technical Analysis Center is an informational tool only and does not constitute investment or trading advice.
This site is registered on wpml.org as a development site. Switch to a production site key to remove this banner.