Generic selectors
Exact matches only
Search in title
Search in content
Post Type Selectors

Popular stocks

Crypto

CFD

Currencies

Support

Gold

NSDQ – Technical Analysis – 4h

September 11, 2025 07:00

Quick Summary

The chart depicts an ongoing bullish trend with increasing highs and lows since mid-August.

The asset is approaching a significant resistance level, crucial for continued upward momentum.

Candlestick Analysis

The overall trend appears bullish, with a series of higher highs and higher lows forming since the mid-August pullback.

Recently, there are signs of potential bullish continuation, as seen in the cluster of green candles near recent highs.

Slight indecision is noted by doji-like candles, which could indicate hesitation to break above current resistance.

MACD Analysis

The MACD line is above the Signal line, indicating bullish momentum. The lines have been diverging recently, suggesting strengthening momentum.

Positive bars are growing in the MACD histogram, supporting a bullish stance and suggesting ongoing upward momentum.

No significant divergences observed between the MACD and the price action currently.

Volume Analysis

Volume has been relatively steady, with a few spikes coinciding with upward price movement, lending credibility to the bullish trend.

Consistent volume supports the current price trend, with a sharp increase in volume accompanying the most recent upward move.

The volume spikes might indicate institutional buying, particularly noticeable during the recent upward push.

Support & Resistance

Key support level is around 23,200, where previous consolidation occurred.

Resistance is evident at the 24,000 level, where price action previously halted.

Sellers are potentially active at this resistance level.

Actionable Insights

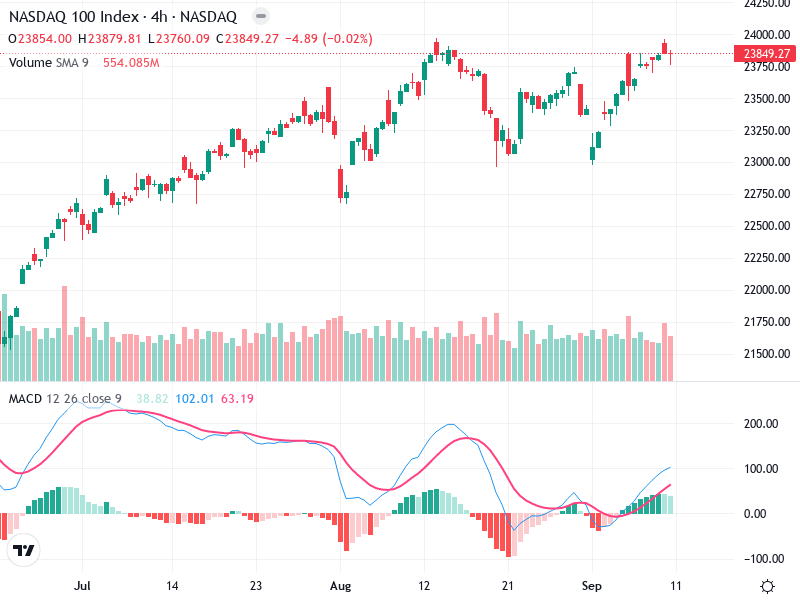
Consider buying if the index breaks and closes above the 24,000 level on strong volume, confirming a breakout.

Look for sell signals if price action forms a strong reversal pattern at the 24,000 resistance, especially combined with bearish MACD signals.

Hold positions if price remains between the 23,200 support and 24,000 resistance to wait for a directional breakout.

The AI Technical Analysis Center is an informational tool only and does not constitute investment or trading advice.
This site is registered on wpml.org as a development site. Switch to a production site key to remove this banner.