Generic selectors
Exact matches only
Search in title
Search in content
Post Type Selectors

Popular stocks

Crypto

CFD

Currencies

Support

Gold

GOLD – Technical Analysis – 4h

September 11, 2025 07:12

Quick Summary

The analysis of the gold Futures chart reveals significant trends and patterns. Recent movements indicate potential shifts in the market dynamic. Traders should remain vigilant for potential opportunities.

Candlestick Analysis

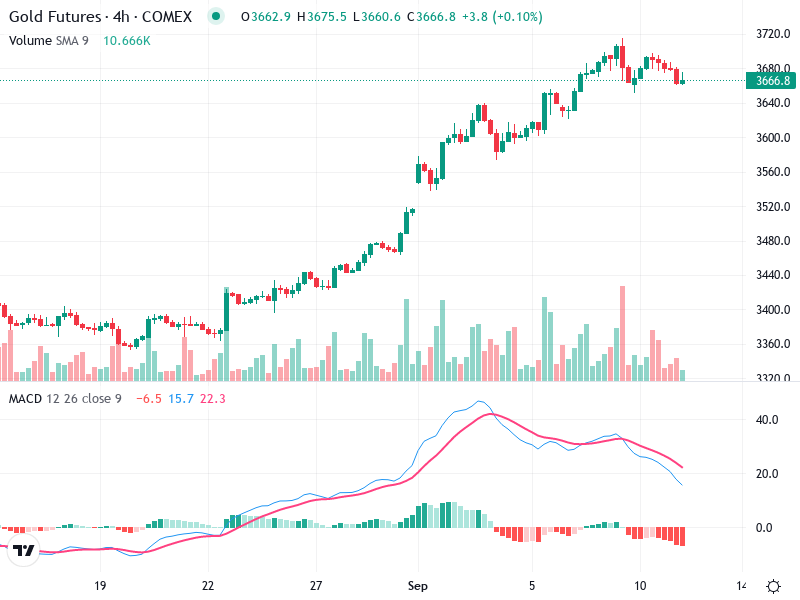
The chart shows a strong bullish trend leading up to recent days, where it appears to be stalling, suggesting possible consolidation or a pullback.

There are no distinct short-term reversal patterns such as doji, hammer, or bullish/bearish engulfing visible at the current level.

Significant upward movement around early September indicates a breakout from prior resistance. However, recent candles suggest a potential pullback zone near 3660.

MACD Analysis

The MACD line (blue) has crossed below the Signal line (red), indicating a bearish crossover and potential downward momentum.

The MACD histogram has turned negative, further suggesting weakening momentum.

There appears to be a negative divergence, as price levels have recently increased while the MACD had been decreasing, which could suggest a weakening trend.

Volume Analysis

A notable increase in volume accompanies the strong uptrend, validating the upward price movement.

Recently, volume has tapered off, aligning with the current price consolidation.

The sharp volume spikes during the bullish trend suggest possible institutional buying, which drove the prices higher.

Support & Resistance

Immediate resistance appears around 3700 - 3720, where the price action recently stalled.

Key support is evident around 3600-3620, providing a potential level for bounce or further consolidation.

Monitoring these levels is essential for future strategic decisions.

Actionable Insights

Consider buying on a confirmed bounce off the 3600 support with improvement in MACD and volume indicators for continuation of the bullish trend.

A price drop below the 3600 support with increasing volume and bearish MACD signals might suggest selling or shorting opportunities.

For current positions, watching how the price reacts around support with volume confirmation is crucial for deciding the next move.

The AI Technical Analysis Center is an informational tool only and does not constitute investment or trading advice.
This site is registered on wpml.org as a development site. Switch to a production site key to remove this banner.