Generic selectors
Exact matches only
Search in title
Search in content
Post Type Selectors

Popular stocks

Crypto

CFD

Currencies

Support

Gold

EUR/USD – Technical Analysis – 4h

September 12, 2025 07:02

Quick Summary

The chart is demonstrating crucial price levels that traders should monitor. A breakout or breakdown from these levels could define the future directional trend.

With the asset showing a mixture of trends, attention to detailed analysis is pivotal.

Candlestick Analysis

There are some bullish engulfing patterns visible after the downtrends, which might indicate strong support and potential reversal.

The chart shows a sideways trend with short-term bullish movements followed by pullbacks.

Resistance is seen around 1.1780, with support near 1.1600, indicating a range-bound market. Watch for a breakout above 1.1780 for a potential bullish continuation.

MACD Analysis

The MACD line is currently above the Signal line, indicating a bullish crossover. However, the lines are close, suggesting cautious optimism.

The histogram is in positive territory but shows decreasing momentum, which might indicate a potential slowdown.

No significant divergences noted between MACD and price action at this time.

Volume Analysis

Volume shows spikes that correspond with larger price bars, suggesting some institutional activity.

The volume supports the price increase near potential breakout zones, adding weight to potential upward movements.

Particularly noticeable around price attempts to breach resistance, indicating strong interest.

Support & Resistance

Strong resistance is seen at 1.1780.

Key support level is around 1.1600.

These levels are crucial for future price action, especially regarding any breakouts.

Actionable Insights

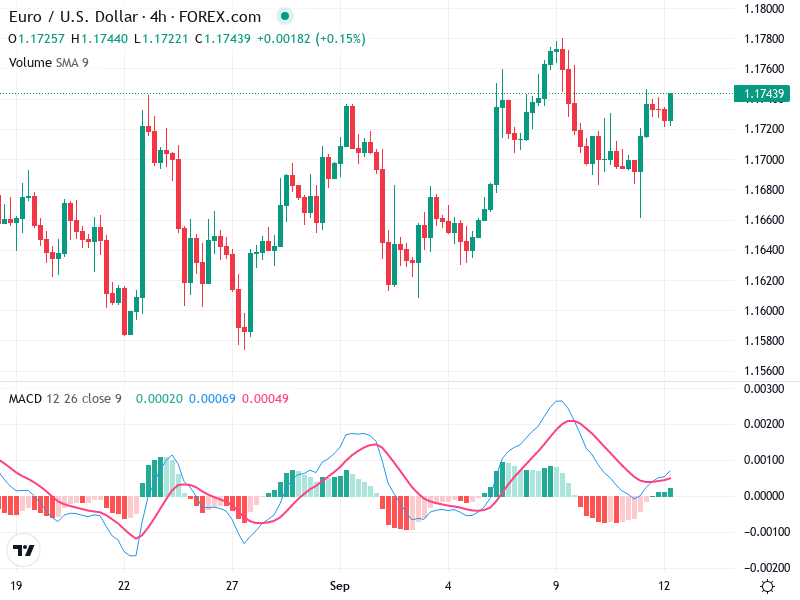
Consider a buy strategy if the price breaks convincingly above the 1.1780 resistance with increased volume. Conversely, a rejection at this level offers a potential short opportunity targeting 1.1600.

Watch for a volume-backed breakout above 1.1780 for confirmation of a bullish move. On the downside, be cautious of breakdowns below 1.1600.

The sideways nature and reactionary volume spikes suggest uncertainty, possibly due to external economic factors.

The AI Technical Analysis Center is an informational tool only and does not constitute investment or trading advice.
This site is registered on wpml.org as a development site. Switch to a production site key to remove this banner.