Generic selectors
Exact matches only
Search in title
Search in content
Post Type Selectors

Popular stocks

Crypto

CFD

Currencies

Support

Gold

GBP/USD – Technical Analysis – 4h

September 12, 2025 07:10

Quick Summary

The GBP/USD chart indicates a potential reversal around early September, supported by significant candlestick patterns and volume spikes.

The pair has been trading sideway to slightly bullish, with key levels in focus for potential breakouts.

Candlestick Analysis

The chart shows a few bullish engulfing patterns around September 4th, indicating a potential reversal from the previous downtrend.

A doji appears around September 9th, suggesting market indecision and potential reversal in the short term.

The overall trend appears to be sideways to slightly bullish after the recovery from the dip around early September.

MACD Analysis

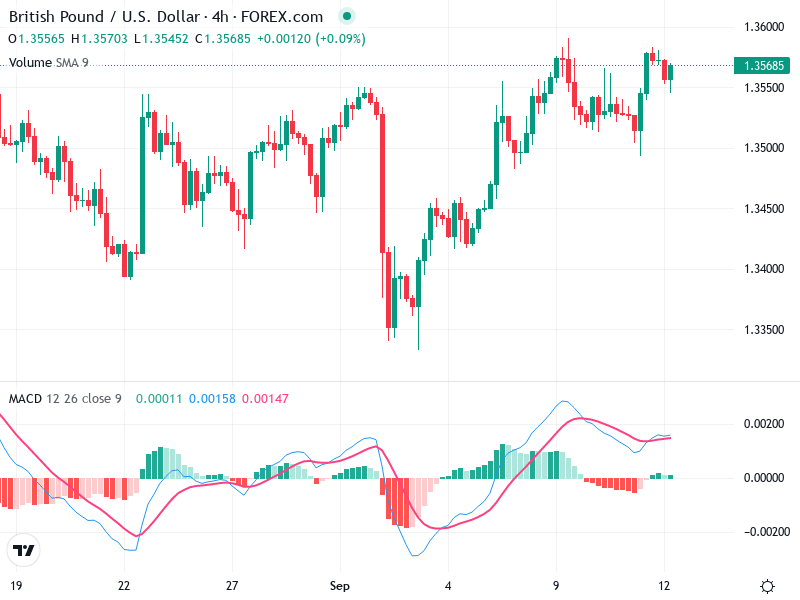
The MACD line (blue) is above the Signal line (red), indicating bullish momentum, although the lines are close and could potentially cross, suggesting caution.

The histogram is slightly positive, indicating weak bullish momentum. Recent bars suggest slowing momentum, meriting cautious observation.

No significant divergences observed between the MACD and price action, suggesting trend confirmation for the short term.

Volume Analysis

Volume showed a spike during the early September reversal, supporting the bullish move that followed.

Recent volume is lower, typical for consolidation phases.

The volume spike around September 4th may suggest institutional activity, aligning with the trend reversal pattern observed.

Support & Resistance

1.3500 is a key support zone, having held multiple tests.

1.3600 is a critical resistance, with previous tests showing rejections.

These levels are crucial for determining potential breakouts or reversals. A break past 1.3600 with volume could suggest a bullish continuation.

Actionable Insights

Buy: If price breaks above 1.3600 with strong volume confirming the move.

Sell: Consider selling if the MACD shows a bearish crossover or if price rejects 1.3600 again.

Hold: If price remains between 1.3500 and 1.3600 without clear breakout or breakdown.

The AI Technical Analysis Center is an informational tool only and does not constitute investment or trading advice.
This site is registered on wpml.org as a development site. Switch to a production site key to remove this banner.