Generic selectors
Exact matches only
Search in title
Search in content
Post Type Selectors

Popular stocks

Crypto

CFD

Currencies

Support

Gold

OIL – Technical Analysis – 4h

September 12, 2025 07:12

Quick Summary

This analysis centers on the with current market trends and technical insights.

The chart depicts significant changes, providing vital cues for informed trading decisions.

Candlestick Analysis

The chart displays a general downward trend from early September after a significant peak.

Several doji candlesticks are present, indicating market indecision and suggesting potential trend reversals.

Consecutive red candles have been noted, pointing toward a bearish continuation.

MACD Analysis

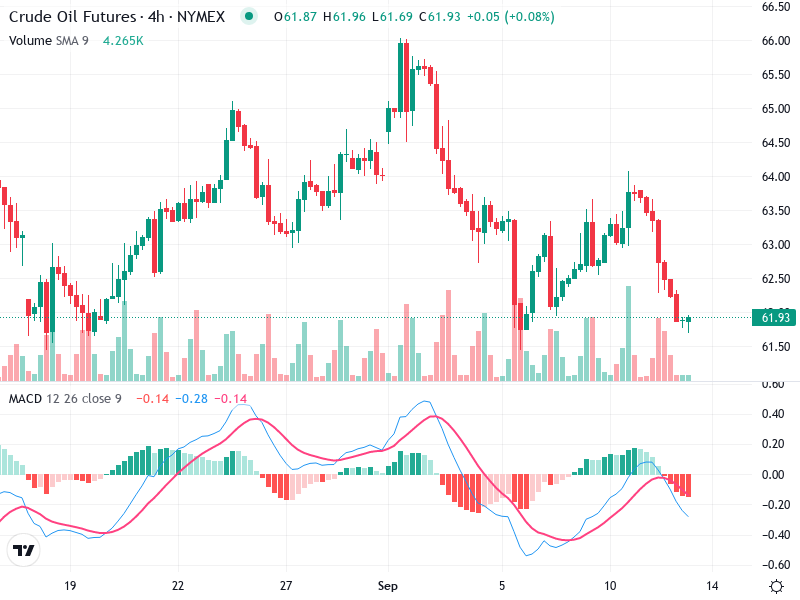
The MACD line is crossing below the Signal line, indicating a bearish crossover and potential downward momentum.

The histogram is negative and expanding, confirming the bearish momentum.

No clear divergences currently, but previous divergences supported earlier uptrends.

Volume Analysis

Volume spikes align with major price moves, supporting the trends' validity.

The increased volume during the recent decline suggests institutional selling.

No contradictions are evident; volume supports the current price action.

Support & Resistance

Support is near 61.5, acting as a potential reversal point or breakdown zone.

Resistance is around 65.5, identified as a barrier during earlier rallies.

This supports the analysis of potential future movements.

Actionable Insights

Consider selling or shorting if the price breaks below the support at 61.5 with volume confirmation.

If holding positions, monitor price action around current support levels.

Look for reversal signals at support levels with bullish candlestick patterns for potential entry.

The AI Technical Analysis Center is an informational tool only and does not constitute investment or trading advice.
This site is registered on wpml.org as a development site. Switch to a production site key to remove this banner.