Generic selectors
Exact matches only
Search in title
Search in content
Post Type Selectors

Popular stocks

Crypto

CFD

Currencies

Support

Gold

GOLD – Technical Analysis – 4h

September 12, 2025 07:14

Quick Summary

This chart illustrates the asset’s recent market behavior.

Signs of both bullish momentum and consolidation are evident.

The asset is currently testing key support and resistance levels.

Candlestick Analysis

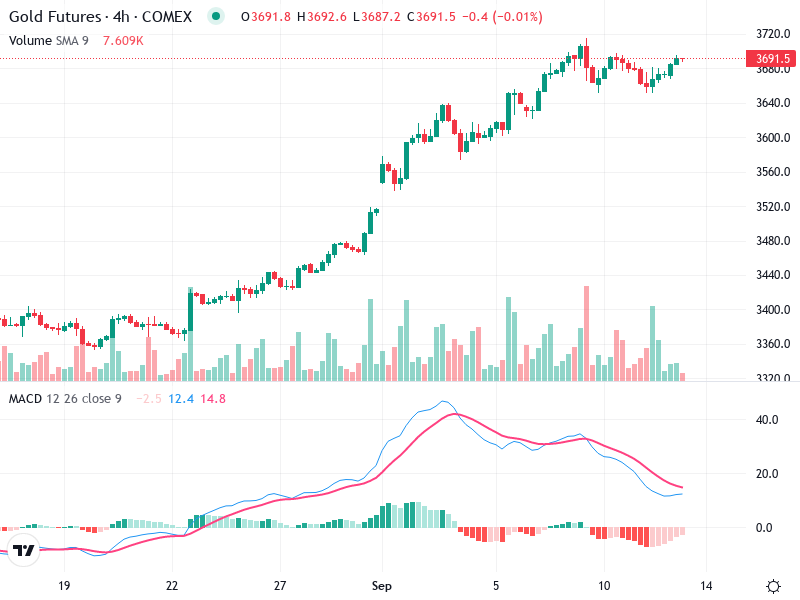
The overall trend on this chart has been bullish, with a series of higher highs and higher lows.

There are no clear standout candlestick formations like bullish engulfing or doji present in the recent bars, which suggests a lack of immediate reversal signals.

Price attempted a breakout above the recent high but pulled back slightly, indicating a potential resistance zone around 3700.

MACD Analysis

The MACD line is below the Signal line, suggesting a bearish crossover that previously occurred indicates weakening momentum.

The MACD histogram is showing diminishing bearish momentum as it begins to rise, pointing towards a potential pause or reversal in the bearish trend.

No clear divergence is noted between MACD and price action currently.

Volume Analysis

There was a recent increase in volume during the previous price rise, supporting the bullish move.

The volume is now receding as price consolidates, which is typical in consolidation phases.

No unusual spikes are currently noted that would indicate strong institutional buying or selling.

Support & Resistance

Resistance is around 3700, as recent candles show price struggling to break this level.

A key support zone appears around the 3600 mark, where price found support during the latest pullbacks.

Actionable Insights

Consider a 'hold' strategy until confirmation of a breakout above 3700 or a reversal signal near the support.

Watch for a sustained close above the resistance level of 3700 with increased volume could validate a potential breakout leading to further upward movement.

Conversely, a significant drop below 3600 with high volume could imply a bearish move.

The AI Technical Analysis Center is an informational tool only and does not constitute investment or trading advice.
This site is registered on wpml.org as a development site. Switch to a production site key to remove this banner.