Generic selectors
Exact matches only
Search in title
Search in content
Post Type Selectors

Popular stocks

Crypto

CFD

Currencies

Support

Gold

GBP/USD – Technical Analysis – 4h

September 15, 2025 07:09

Quick Summary

The chart of the Asset indicates a period of consolidation with minor bullish tendencies. The price has been moving slightly higher, forming higher highs and higher lows, albeit in a somewhat sideways manner. Traders should keep a close eye on key levels for potential breakout or reversal signals.

Candlestick Analysis

The chart shows a mix of bullish and bearish candlesticks with no dominant pattern suggesting a clear reversal or continuation. Instances of doji candles indicate market indecision.

There is a slight bullish trend visible as the price makes higher highs and higher lows, though the movement is currently sideways, suggesting consolidation.

Resistance around 1.3600 serves as a key level for a potential breakout, while the price might pull back if this level isn't surpassed.

MACD Analysis

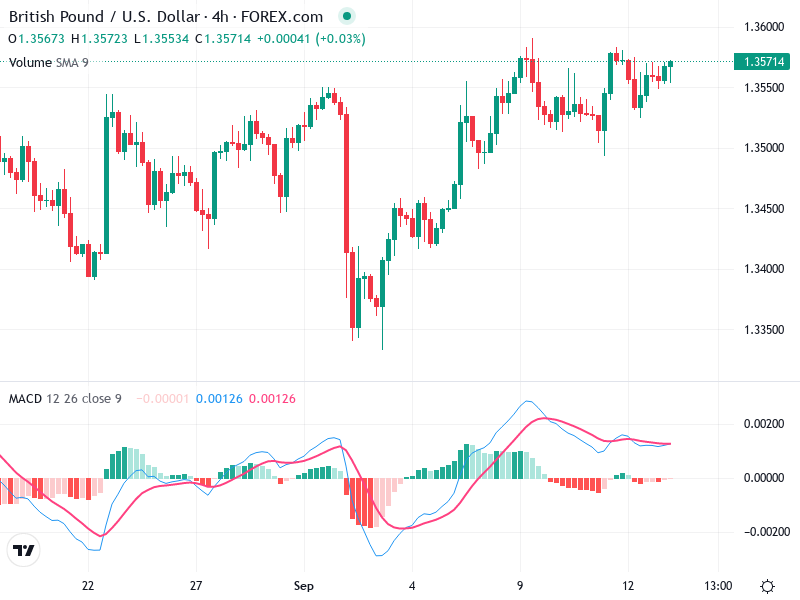
The MACD line is close to the Signal line, hinting at a potential bullish crossover in past periods, which calls for cautious optimism.

The histogram indicates slight positive momentum, suggesting an upward bias, though it is not strongly pronounced.

No clear divergences between MACD and price action are present, indicating alignment between momentum and price.

Volume Analysis

Volume remains steady with minor fluctuations, lacking any significant spikes that would suggest heightened buying or selling pressure.

This steady volume aligns with the current consolidation phase, signaling that a breakout will likely require an increase in volume for confirmation.

No unusual volume spikes suggest institutional trading activities currently.

Support & Resistance

Resistance is noted around 1.3600, a challenging level for the price to surpass.

Support is identified near 1.3400, which has served as a base in past sessions.

Breaking above resistance could trigger further upward moves, while falling below support might signal a trend reversal.

Actionable Insights

Consider entering long positions on a confirmed breakout above 1.3600, especially if supported by increased volume.

Short positions could be explored if the price breaks below support at 1.3400.

Holding might be the best strategy currently until a clear breakout or breakdown is observed.

The AI Technical Analysis Center is an informational tool only and does not constitute investment or trading advice.
This site is registered on wpml.org as a development site. Switch to a production site key to remove this banner.