March 13, 2026 08:00 NSDQ – Technical Analysis – 4h The NASDAQ 100 Index shows a cautious market sentiment with a downside risk bias. Although there are no strong bullish signals, careful monitoring is advised.
March 12, 2026 08:00 NSDQ – Technical Analysis – 4h The chart shows a consolidated trend with a slight bearish inclination, reflecting a market lacking clear directional movement. Observations indicate a sideways movement, with price…
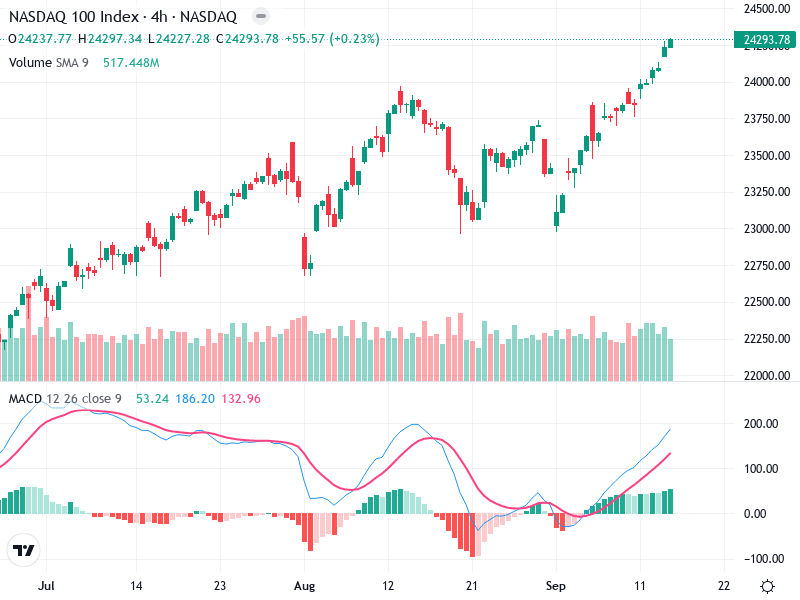
March 11, 2026 08:01 NSDQ – Technical Analysis – 4h The NASDAQ 100 Index is currently exhibiting various technical signals. The 4-hour chart shows a mixture of bullish and bearish patterns, indicating a complex outlook.…