Generic selectors
Exact matches only
Search in title
Search in content
Post Type Selectors

Popular stocks

Crypto

CFD

Currencies

Support

Gold

GBP/USD – Technical Analysis – 4h

September 16, 2025 07:09

Quick Summary

The GBP/USD 4-hour chart shows a promising uptrend driven by strong bullish indicators.

Key technical patterns and momentum indicators point towards sustained gains.

Investors should consider the bullish sentiment and potential strategic trading opportunities.

Candlestick Analysis

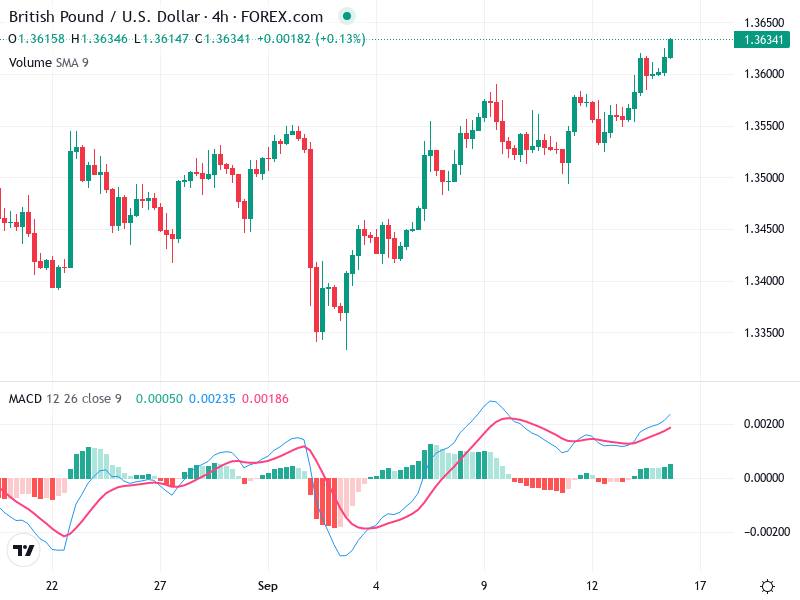
The overall trend appears to be bullish, especially towards the end of the chart, with a series of higher highs and higher lows.

No major reversal patterns like a hammer or a doji are evident, but the recent bullish candles with longer bodies suggest strong buying interest.

A breakout above the 1.3615 level has occurred, indicating a continuation of the upward movement.

MACD Analysis

The MACD line is above the Signal line, indicating a bullish crossover, which typically suggests upward momentum.

The MACD histogram bars are positive and increasing in size, reinforcing the strength of the bullish momentum.

There are no clear divergences between the MACD and price action, supporting the current upward trend.

Volume Analysis

There's an increasing volume trend accompanying the recent price increase, which confirms the validity of the upward price movement.

The volume appears steady without unusual spikes, suggesting consistent trader participation rather than abrupt institutional moves.

This consistent volume helps support the ongoing upward trend.

Support & Resistance

Support is around 1.3550, where price previously consolidated before the latest upward movement.

Immediate resistance is less visible, suggesting potential for further upward movement.

These levels highlight areas of potential buying and selling pressure.

Actionable Insights

Consider buying on pullbacks near support levels, particularly if followed by a bullish candlestick pattern.

Watch for any reversal patterns or a bearish MACD crossover before considering selling.

Confirm a continued uptrend with potential new highs or signs of exhaustion like decreasing volume on upward candles.

The AI Technical Analysis Center is an informational tool only and does not constitute investment or trading advice.
This site is registered on wpml.org as a development site. Switch to a production site key to remove this banner.