Generic selectors
Exact matches only
Search in title
Search in content
Post Type Selectors

Popular stocks

Crypto

CFD

Currencies

Support

Gold

OIL – Technical Analysis – 4h

September 16, 2025 07:11

Quick Summary

The chart indicates a recent bearish trend followed by a period of sideways movement. Technical indicators suggest potential upcoming shifts in momentum.

The overall market sentiment appears cautious, with traders awaiting strong directional signals.

Candlestick Analysis

Significant patterns like the Bullish Engulfing observed in early September suggested a temporary bullish reversal.

The chart shows a bearish trend from mid-August to early September, followed by a sideways movement in recent periods.

A breakout above $65 in late September was reversed, with consolidation observed around $63.

MACD Analysis

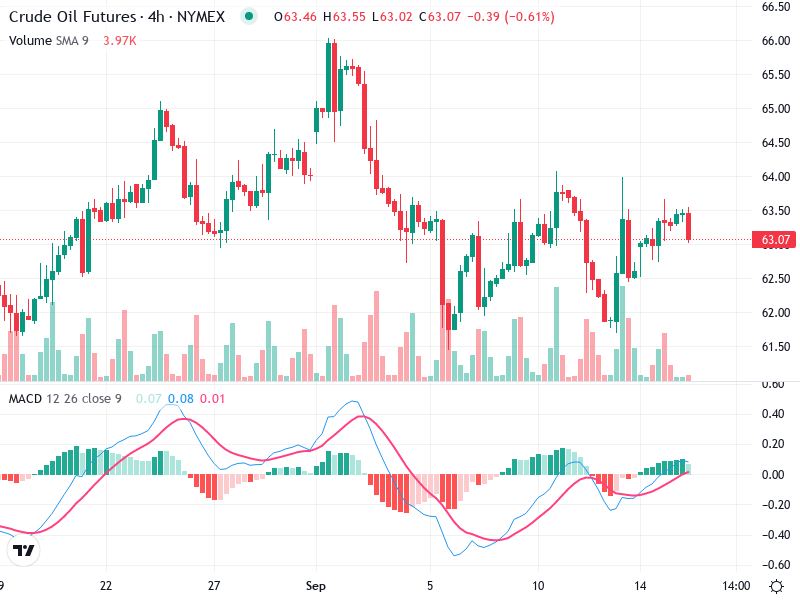
The MACD line is slightly above the Signal line, suggesting weak bullish momentum.

The histogram indicates decreasing positive momentum, pointing to a possible convergence or bearish crossover.

No significant divergence between MACD and price action is currently observed, reflecting recent sideways movement.

Volume Analysis

There was a noticeable increase in volume during the price decline towards early September.

Current low volumes are consistent with sideways price movement, suggesting a lack of conviction from traders.

No prominent spikes in volume recently, indicating no major institutional activity.

Support & Resistance

Support is around $62.50, tested multiple times without a significant breach.

Resistance is around $64, where price has faced rejections several times.

A breakout above $64 with strong volume could indicate a bullish move, while failure to maintain $62.50 might result in further decline.

Actionable Insights

Consider entering a buy position if price breaks above $64 with increased volume.

Look for bearish setups if the price drops below $62.50 with strong selling volume.

For current positions, watch for a clearer trend direction confirmation.

The AI Technical Analysis Center is an informational tool only and does not constitute investment or trading advice.
This site is registered on wpml.org as a development site. Switch to a production site key to remove this banner.