Generic selectors
Exact matches only
Search in title
Search in content
Post Type Selectors

Popular stocks

Crypto

CFD

Currencies

Support

Gold

GOLD – Technical Analysis – 4h

September 16, 2025 07:13

Quick Summary

The chart exhibits a predominantly bullish trend, with a sequence of higher highs and higher lows apparent. Key technical indicators suggest continued momentum in this direction.

Investors should be attentive to breakout levels and volume changes to adjust their strategies accordingly. Overall, appears poised for potential gains if current conditions persist.

Candlestick Analysis

The chart shows a generally bullish trend with a series of higher highs and higher lows.

No specific strong reversal candlestick patterns like a bullish engulfing or doji are distinctly visible at key turning points in this timeframe.

Currently, the price appears to be testing a potential breakout zone around 3730. Sustained movement above this level could indicate further bullish momentum.

MACD Analysis

The MACD line is above the Signal line after a recent bullish crossover, indicating increasing bullish momentum.

The MACD histogram is positive and rising, suggesting strengthening momentum in the bullish direction.

There are no clear divergences between MACD and price action at this time, supporting the existing trend.

Volume Analysis

Volume seems to increase during price rallies, supporting the bullish trend. There isn’t a significantly unusual spike, indicating steady trading activity.

The most recent price increase is supported by a moderate increase in volume, which is healthy for the continuation of an uptrend.

No significant anomalies or spikes in volume suggest institutional activity currently.

Support & Resistance

A key support level appears around 3650, where previous consolidation and reversals occurred.

The current level of 3730 acts as a resistance. A definitive breakout above this level with volume confirmation could signal further upside potential.

Actionable Insights

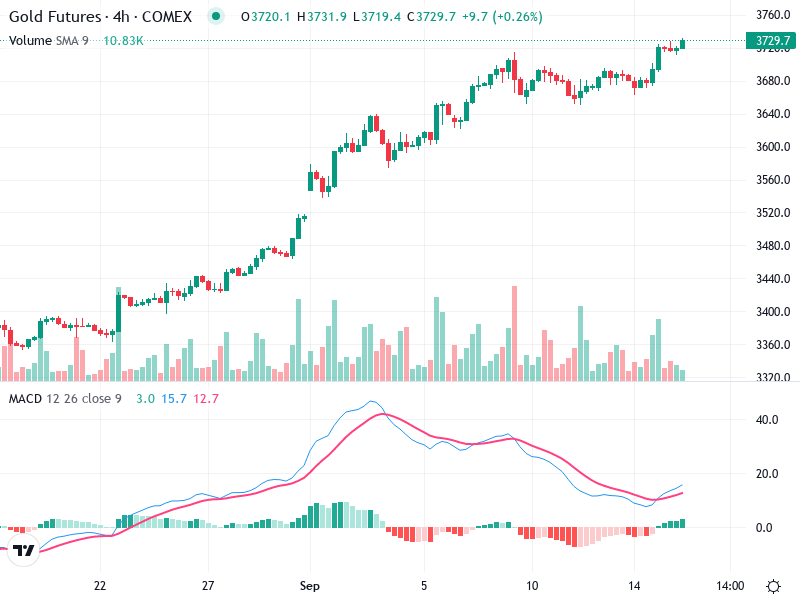
If the price breaks above the 3730 resistance with increased volume, this could be a buy signal for continuation traders.

Conversely, if the price fails to break this level and starts to pull back, it may present a selling or profit-taking opportunity.

Traders should look for confirmation of a breakout through increased volume and sustained trading above the resistance level.

The AI Technical Analysis Center is an informational tool only and does not constitute investment or trading advice.
This site is registered on wpml.org as a development site. Switch to a production site key to remove this banner.