Generic selectors
Exact matches only
Search in title
Search in content
Post Type Selectors

Popular stocks

Crypto

CFD

Currencies

Support

Gold

AUD/USD – Technical Analysis – 4h

September 17, 2025 07:08

Quick Summary

The AUD/USD chart exhibits a strong upward trend that was evident from late August into mid-September. The recent price movements are confined within key levels, indicating the potential for further bullish momentum or a consolidation phase. It is essential to monitor key indicators such as volume and MACD for signs of upcoming changes.

Candlestick Analysis

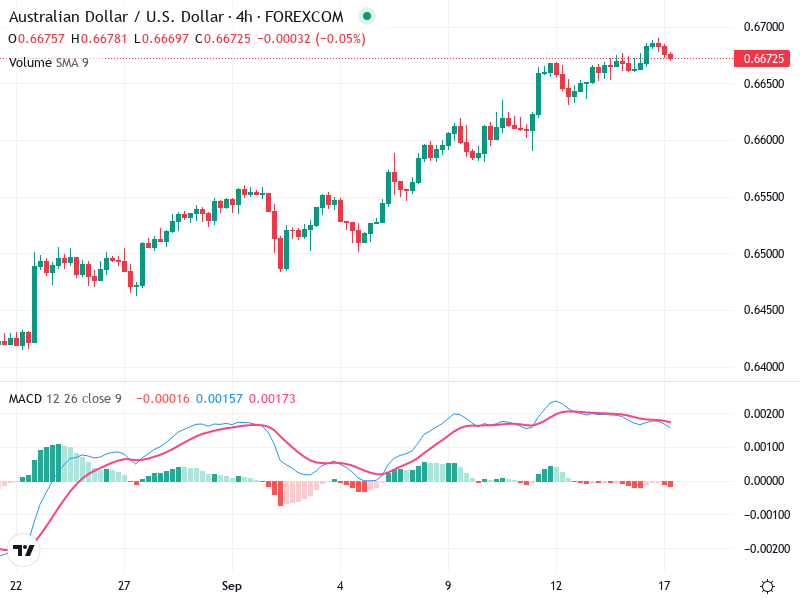
The chart shows a strong bullish trend from late August into mid-September, with a series of higher highs and higher lows.

Recent candles indicate some indecision at the current level. There isn't a clear reversal pattern like a bearish engulfing or hammer. The small-bodied candles suggest a potential pause or consolidation.

The region around 0.6670 seems to be acting as a short-term resistance. A breakout above this could indicate further bullish momentum.

MACD Analysis

The MACD line is approaching the Signal line from above, suggesting a potential bearish crossover. This might indicate weakening momentum.

The histogram has started to move into negative territory, supporting the possibility of a short-term bearish change in momentum.

There's no significant divergence between MACD and price action at this time.

Volume Analysis

Volume appears stable but there's no major increase or spike to suggest strong institutional activity.

The recent uptrend was somewhat supported by stable volume, aligning with the upward price movement.

No prominent volume spikes are visible in the most recent data.

Support & Resistance

Support around 0.6550 acted as a base for the recent bullish run.

Resistance around 0.6670 is shown by the current consolidation and previous highs.

These levels will be critical for confirming potential breakouts or reversals.

Actionable Insights

Consider a buy position if there is a confirmed breakout above 0.6670 with increased volume.

A hold or cautious sell might be appropriate if the MACD confirms a bearish crossover, especially if the price dips below the recent support levels.

Watch for confirmation signals such as a significant breakout with volume increase or continue monitoring MACD's behavior.

The AI Technical Analysis Center is an informational tool only and does not constitute investment or trading advice.
This site is registered on wpml.org as a development site. Switch to a production site key to remove this banner.