Generic selectors
Exact matches only
Search in title
Search in content
Post Type Selectors

Popular stocks

Crypto

CFD

Currencies

Support

Gold

GBP/USD – Technical Analysis – 4h

September 17, 2025 07:10

Quick Summary

The GBP/USD chart is displaying upward momentum with a bullish trend. A key resistance level has been identified, which could influence future movements of the asset. Observing these levels could provide actionable insights for traders.

Candlestick Analysis

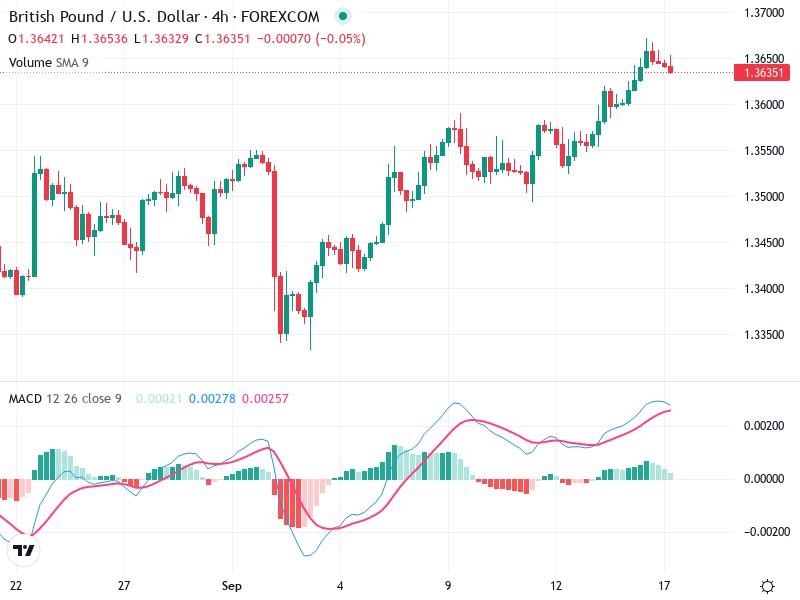
The chart displays a bullish trend with higher highs and higher lows, indicating upward momentum.

No distinct reversal patterns like doji, hammer, or engulfing candlesticks are immediately visible in the current uptrend.

The bullish momentum is sustained, reflecting consistent buying interest.

MACD Analysis

The MACD line is above the Signal line, indicating a bullish crossover.

Positive bars on the histogram show strengthening bullish momentum. However, the histogram is slightly narrowing, suggesting a possible slowing of momentum.

No clear divergence between the MACD and the price action right now. The MACD is confirming the current uptrend.

Volume Analysis

Volume appears to be relatively stable with no significant spikes visible on the chart.

The consistent volume supports the ongoing price trend, reinforcing the validity of the bullish move.

No unusual volume spikes, suggesting a steady accumulation rather than impulsive buying.

Support & Resistance

The immediate resistance is the recent high around 1.3650. A breakout above this could see further gains.

Recent support is around the 1.3550 level, where buying interest has previously emerged.

Breaking and holding above 1.3650 will be crucial for confirming further upsides, while holding support at 1.3550 will maintain the bullish outlook.

Actionable Insights

Consider buying on a confirmed breakout above 1.3650 with increased volume.

Watch for any bearish reversal patterns near resistance or a break below 1.3550 for shorting opportunities.

Holding current long positions could be beneficial while observing resistance tests.

The AI Technical Analysis Center is an informational tool only and does not constitute investment or trading advice.
This site is registered on wpml.org as a development site. Switch to a production site key to remove this banner.