Generic selectors
Exact matches only
Search in title
Search in content
Post Type Selectors

Popular stocks

Crypto

CFD

Currencies

Support

Gold

GOLD – Technical Analysis – 4h

September 17, 2025 07:14

Quick Summary

The gold Futures chart presents a cautious outlook with signs of reduced momentum. While the overall trend has been bullish, recent patterns suggest a potential shift. Traders should monitor key support and resistance levels for confirmed movements.

Candlestick Analysis

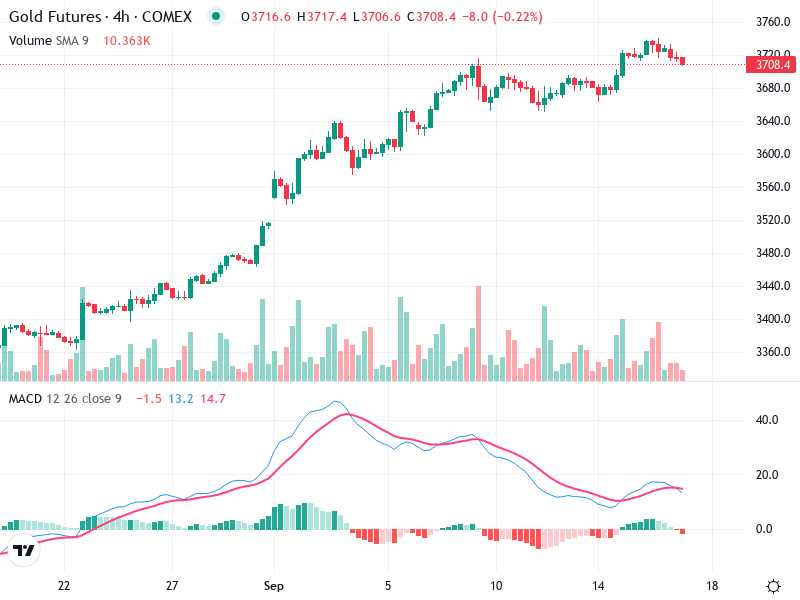
During the recent period, there is no clear standout candlestick pattern like a bullish engulfing or hammer. However, some smaller doji and indecision patterns appear, suggesting a potential shift in momentum.

The primary trend appears bullish, with a series of higher highs and higher lows. However, the momentum seems to be stalling, as indicated by the small, indecisive candlestick formations in the latest period.

A potential breakout zone exists around 3716-3720, which it has tested but not decisively broken. Pullback support can be seen near 3680.

MACD Analysis

The MACD line is slightly below the signal line, indicating a bearish crossover. This signals potential weakening of the bullish momentum.

The histogram is in a decreasing phase and has turned negative, suggesting declining bullish momentum and the potential for a bearish shift.

There is no clear divergence between the MACD and price action currently, but the decreasing histogram indicates waning momentum.

Volume Analysis

The volume has been decreasing slightly which might coincide with the weakening momentum indicated by the MACD.

The lack of strong volume accompanying the recent price consolidations suggests a lack of strong buying conviction.

No significant volume spikes signaling institutional activity are observed.

Support & Resistance

Solid support is identified around the 3680 level where price has previously bounced.

Strong resistance appears near the 3720 mark, which the price has struggled to maintain.

A break below support might suggest a further decline, while a break above resistance could signify a continuation of the bullish trend.

Actionable Insights

Consider entering if the price breaks and closes above the 3720 resistance with strong volume confirmation.

A breach below 3680 with accompanying volume may indicate a short opportunity.

Until clear directional strength is shown, holding might be a conservative approach.

The AI Technical Analysis Center is an informational tool only and does not constitute investment or trading advice.
This site is registered on wpml.org as a development site. Switch to a production site key to remove this banner.