Generic selectors
Exact matches only
Search in title
Search in content
Post Type Selectors

Popular stocks

Crypto

CFD

Currencies

Support

Gold

EUR/USD – Technical Analysis – 4h

September 18, 2025 07:02

Quick Summary

The chart recently experienced noticeable movements, reflecting shifts in market sentiment.

Observations indicate potentially critical levels that might influence future price actions.

Candlestick Analysis

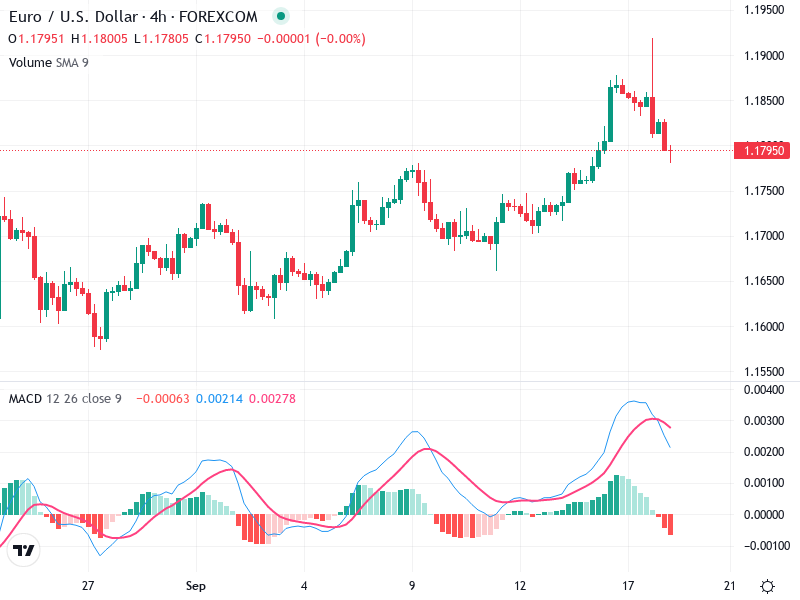
The chart exhibits a recent bullish trend with higher highs and higher lows, however, the last few candles indicate a potential reversal or pullback.

The recent candlestick towards the right suggests a bearish influence, with a strong red candle following a peak, indicative of a reversal pattern (possibly evening star).

There’s a potential breakout zone around 1.1850, where price previously peaked and pulled back sharply.

MACD Analysis

The MACD line has crossed below the Signal line, suggesting a bearish crossover which indicates a potential downturn in momentum.

The MACD histogram shows increasing red bars, reflecting strengthening bearish momentum and confirming the negative sentiment shift.

There isn’t any significant divergence observed; MACD aligns with the recent price decline.

Volume Analysis

Volume does not show significant spikes. However, the volume consistency supports the recent price actions.

The lack of significant volume spike during the price drop suggests the move may lack strong conviction, implying it could be part of a correction rather than a complete trend reversal.

No major volume surges but steady levels supporting the bearish sentiment.

Support & Resistance

Key support is around 1.1700, where previous bounces have occurred.

Strong resistance zone is around 1.1850, as price failed to sustain above it.

Breaking below the support could confirm a bearish reversal, and conversely, breaking above the resistance with volume confirmation could resume the bullish trend.

Actionable Insights

Consider a hold or potential sell if price action remains below the 1.1850 resistance with confirmation of the bearish trend.

Monitor for a reversal candlestick pattern near the 1.1700 support zone, or a bullish MACD crossover as potential buy signals.

Stay alert to changes especially if prices approach critical levels.

The AI Technical Analysis Center is an informational tool only and does not constitute investment or trading advice.
This site is registered on wpml.org as a development site. Switch to a production site key to remove this banner.