March 13, 2026 13:04 GBP/USD – Technical Analysis – 4h The chart for shows a predominantly bearish trend, indicating a potential continuation of the downturn. The asset has been displaying lower highs and lower lows…
March 13, 2026 13:02 AUD/USD – Technical Analysis – 4h The AUD/USD 4-hour chart reveals significant technical insights. Candlestick patterns are suggesting potential reversals, and recent price actions indicate a prevailing trend. MACD and volume…
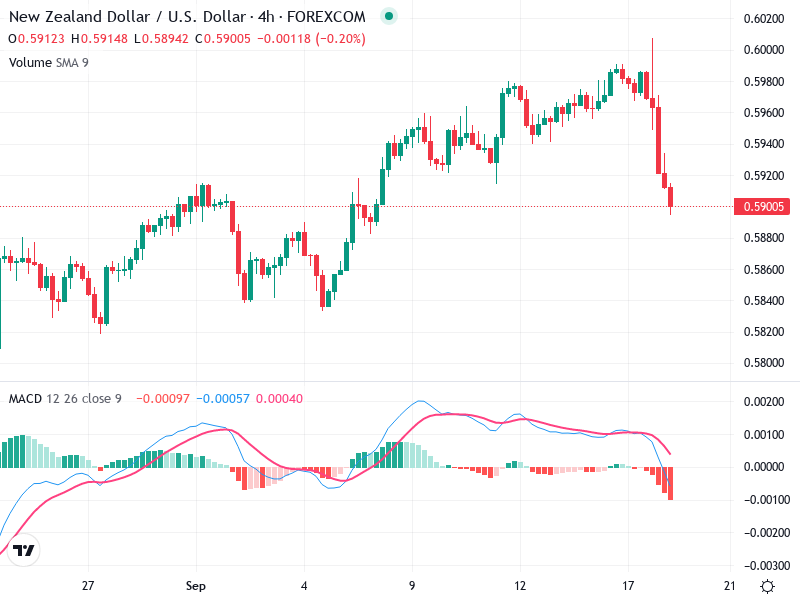
March 13, 2026 13:00 NZD/USD – Technical Analysis – 4h The Asset chart shows significant patterns that could influence future movements. The overall analysis suggests mixed sentiments with indicators supporting various trends.